numpy fmod – Python NumPy fmod() Function

Python NumPy fmod() Function

NumPy fmod() Function:

Numpy fmod: The fmod() function of the NumPy module returns the remainder of the division element-by-element.

In terms of array broadcasting, it is equivalent to l1 % l2.

The remainder has the same sign as the dividend l1 in this NumPy implementation of the C library function fmod. It is not to be confused with the Python modulus operator l1 % l2. It is equivalent to the Matlab rem function.

Syntax:

numpy.fmod(l1, l2, out=None)

Parameters:

l1 and l2: (Required)

fmod() python: These are required arguments. These are the arrays that have to be divided, here l1 as dividend and l2 as the divisor.

They must be broadcastable to a common shape if l1.shape!= l2.shape.

out:

This is optional. It is the location where the result will be saved. It must have a shape that the inputs broadcast to if it is provided. If None or not given, a newly allocated array is returned.

Return Value:

The element-by-element remainder of dividing l1 and l2 is returned.

NumPy fmod() Function in Python

Example

Approach:

  • Import NumPy module using the import keyword.
  • Pass some random list as an argument to the array() function to create an array.
    Store it in a variable.
  • Create some sample arrays of different shapes to test the fmod() function.
  • Pass the first array and some random number to fmod() function of NumPy module and print the result.
  • Here it divides each element of the array1 with the given random value say 9 and gives the remainder.
  • Pass the first array and second array to fmod() function of NumPy module and print the result.
  • Here it divides second array elements for the first array element and gives the remainder
  • Print the result array.
  • Similarly, test it with other arrays of different shapes.
  • The Exit of the Program.

Below is the implementation:

# Import NumPy module using the import keyword.
import numpy as np
# Pass some random list as an argument to the array() function to create an array.
# Store it in a variable.
arry1 = np.array([[32,64],[95,128],[150,180]])
# Create some sample arrays of different shapes to test the fmod() function.
arry2 = np.array([[10,20]])
arry3 = np.array([[100],[200],[300]])
arry4 = np.array([[55,65],[75,85],[95,105]])
# Pass the first array and some random number to fmod() function of NumPy module and print the result.
# Here it divides each element of the array1 with the given random value say 9 and gives the remainder.
print('Getting fmod value by dividing first array with 9: ')
print(np.fmod(arry1, 9))
# Pass the first array and second array to fmod() function of NumPy module and print the result.
# Here it divides second array elements for the first array element and gives the remainder
# Print the result array.
print('Getting fmod value by dividing first array with second array: ')
print(np.fmod(arry1, arry2))
# Similarly, test it with other arrays of different shapes.
print('Getting fmod value by dividing first array with third array: ')
print(np.fmod(arry1, arry3))
print('Getting fmod value by dividing first array with fourth array: ')
print(np.fmod(arry1, arry4))

Output:

Getting fmod value by dividing first array with 9: 
[[5 1]
 [5 2]
 [6 0]]
Getting fmod value by dividing first array with second array: 
[[2 4]
 [5 8]
 [0 0]]
Getting fmod value by dividing first array with third array: 
[[ 32 64]
 [ 95 128]
 [150 180]]
Getting fmod value by dividing first array with fourth array: 
[[32 64]
 [20 43]
 [55 75]]


NP.random.shuffle – Python NumPy random.shuffle() Function

numpy-random.shuffle()-function

NP.random.shuffle: The random module is part of the NumPy library. This module includes the functions for generating random numbers. This module includes some basic random data generating methods, as well as permutation and distribution functions and random generator functions.

NumPy random.shuffle() Function:

Numpy random shuffle: The shuffle() function of the NumPy random module is used to modify a sequence in-place by shuffling its contents. When used with a multi-dimensional array, the function just shuffles the items along the first axis.

Syntax:

numpy.random.shuffle(x)

Parameters

x: This is Required. The array or list to be shuffled is specified by this.

Return Value:

It has No return value.

NumPy random.shuffle() Function in Python

Example1

NP random shuffle: Here, the random.shuffle() function shuffles the elements of the list.

Approach:

  • Import numpy module using the import keyword.
  • Pass the lower and upper limit range as arguments to the arange() function to get a list containing elements in the given range(0 to 7 here).
  • Print the above-given list.
  • Pass the above-given list as an argument to the random.shuffle() function to shuffle the elements of the above list.
  • Print the above-given list after shuffling.
  • The Exit of the Program.

Below is the implementation:

# Import numpy module using the import keyword
import numpy as np  
# Pass the lower and upper limit range as arguments to the arange() function
# to get a list containing elements in given range(0 to 7 here)
gvn_lst = np.arange(0, 8)

# Print the above given list
print("The given list is:", gvn_lst)

# Pass the above given list as an argument to the random.shuffle() function
# to shuffle the elements of the above list
np.random.shuffle(gvn_lst)

# Print the above given list after shuffling
print("The above given list after shuffling:", gvn_lst)

Output:

The given list is: [0 1 2 3 4 5 6 7]
The above given list after shuffling: [3 4 1 2 0 7 6 5]

Example2

NP shuffle: When used with a multi-dimensional array, the function just shuffles the items along the first axis.

Approach:

  • Import numpy module using the import keyword.
  • Pass the lower and upper limit range as arguments to the arange() function to get a list containing elements in the given range and reshape it to the given number of rows and columns using the reshape() function.
  • Store it in a variable.
  • Print the above-given matrix (multi-dimensional array)
  • Pass the above-given matrix as an argument to the random.shuffle() function to shuffle the elements of the above matrix.
  • Print the above-given matrix after shuffling.
  • The Exit of the Program.

Below is the implementation:

# Import numpy module using the import keyword
import numpy as np  
# Pass the lower and upper limit range as arguments to the arange() function
# to get a list containing elements in given range and reshape it to given 
# number of rows and columns using the reshape() function
# Store it in a variable.
gvn_matx = np.arange(2, 11).reshape(3,3)
# Print the above given matrix (multi-dimensional array)
print("The given matrix is:\n", gvn_matx)
print()
# Pass the above given matrix as an argument to the random.shuffle() function
# to shuffle the elements of the above matrix
np.random.shuffle(gvn_matx)

# Print the above given matrix after shuffling
print("The above given matrix after shuffling:\n", gvn_matx)

Output:

The given matrix is:
[[ 2 3 4]
 [ 5 6 7]
 [ 8 9 10]]
 
The above given matrix after shuffling:
[[ 8 9 10]
 [ 5 6 7]
 [ 2 3 4]]


Rotate a list python – Python Program to Right Rotate a List by R Times

Program to Right Rotate a List by R Times

Rotate a list python: Interested in programming and want to excel in it by choosing the short ways. Then, practicing with the available Java Program list is mandatory.

Right Rotation of a List:

Python rotate list: An array’s elements are shifted to the right when it is rotated to the right, as demonstrated in the image below. right rotation involves rotating the array’s elements clockwise to the provided number of places.

Examples:

Example1:

Input:

given list =[3, 9, 1, 2, 4, 5, 11, 23]
number of positions = 6

Output:

The list before rotating r times =  [3, 9, 1, 2, 4, 5, 11, 23]
The list after  rotating r times :  [1, 2, 4, 5, 11, 23, 3, 9]

Example2:

Input:

given list =  ['good', 'morning', 'this', 'is', 'btechgeeks']
number of positions = 3

Output:

The list before rotating r times = ['good', 'morning', 'this', 'is', 'btechgeeks']
The list after rotating r times : ['this', 'is', 'btechgeeks', 'good', 'morning']

Program to Right Rotate a List by r Times in Python

Rotate list python: There are several ways to right rotate the given list by r times to the right in Python some of them are:

Method #1:Using Indexing(Static Input)

Approach:

  • Give the list as static input and store it in a variable.
  • Give the number of rotations r as static input and store it in another variable.
  • Pass the given list and number of rotations as arguments to the rightRotateList function which rotates the given list to the right by r positions.
  • Use for loop to loop r times.
  • Pass the given list to the rightRotateOne function inside the for loop which rotates the list to the right one time.
  • Inside the rightRotateOne function follow the below steps.
  • Initialize the last variable to the last element of the given list.
  • Traverse length in reverse order of given list -1 times using for loop and reversed range functions.
  • Initialize the next index element to the current index element inside the For loop.
  • After the loop Initialize the first value of the given list to the last value.
  • In this way, we rotate the given list to the right r times.
  • The Exit of the Program.

Below is the implementation:

# function which accepts the giveen list as argument
# and rotates the given list to the right by one time


def rightRotateByOne(given_list):
    # intializing last variable to the last element of the given list
    lastval = given_list[-1]
    # traversing length in reverse order of given list -1 times using for loop and reversed,range functions
    for i in reversed(range(len(given_list) - 1)):
      # initializing the next index element to the current index element
        given_list[i+1] = given_list[i]
    # Initialize the first value of the given list to the last value.
    given_list[0] = lastval


# function which accepts the given list and number
# of positions as arguments and rotate the given list r times here r=positions
def rightRotateList(given_list, positions):
    # Pass the given list to the rightRotateOne function inside the
    # for loop which rotates the list to the right one time.
    for numb in range(positions):
        rightRotateByOne(given_list)


# Driver Code
# Give the list as static input and store it in a variable.
given_list = [3, 9, 1, 2, 4, 5, 11, 23]
print('The list before rotating r times = ', given_list)
# Give the number of rotations r as static input and store it in another variable.
positions = 6
# Pass the given list and number of rotations as arguments to the rightRotateList function
# which rotates the given list to the right by r positions.
rightRotateList(given_list, positions)
# print the list after rotating to the right r times
print('The list after  rotating r times : ', given_list)

Output:

The list before rotating r times =  [3, 9, 1, 2, 4, 5, 11, 23]
The list after  rotating r times :  [1, 2, 4, 5, 11, 23, 3, 9]

The above solution has a time complexity of, where n is the size of the input and r is the number of rotations.

Method #2:Using Indexing(User Input)

i)Integer List

Approach:

  • Give the integer list as user input using map(),split(),list() and int functions.
  • Store it in a variable.
  • Give the number of rotations r as user input using int(input()) and store it in another variable.
  • Pass the given list and number of rotations as arguments to the rightRotateList function which rotates the given list to the right by r positions.
  • Use for loop to loop r times.
  • Pass the given list to the rightRotateOne function inside the for loop which rotates the list to the right one time.
  • Inside the rightRotateOne function follow the below steps.
  • Initialize the last variable to the last element of the given list.
  • Traverse length in reverse order of given list -1 times using for loop and reversed range functions.
  • Initialize the next index element to the current index element inside the For loop.
  • After the loop Initialize the first value of the given list to the last value.
  • In this way, we rotate the given list to the right r times.
  • The Exit of the Program.

Below is the implementation:

# function which accepts the giveen list as argument
# and rotates the given list to the right by one time


def rightRotateByOne(given_list):
    # intializing last variable to the last element of the given list
    lastval = given_list[-1]
    # traversing length in reverse order of given list -1 times using for loop and reversed,range functions
    for i in reversed(range(len(given_list) - 1)):
      # initializing the next index element to the current index element
        given_list[i+1] = given_list[i]
    # Initialize the first value of the given list to the last value.
    given_list[0] = lastval


# function which accepts the given list and number
# of positions as arguments and rotate the given list r times here r=positions
def rightRotateList(given_list, positions):
    # Pass the given list to the rightRotateOne function inside the
    # for loop which rotates the list to the right one time.
    for numb in range(positions):
        rightRotateByOne(given_list)


# Driver Code
# Give the list as user input using map(),split(),list() and int functions.
# Store it in a variable. 
given_list = list(
    map(int, input('Enter some random list separated by spaces = ').split()))
print('The list before rotating r times = ', given_list)
# Give the number of rotations r as user input using int(input())
# and store it in another variable.
positions = int(input('Enter some random number of positions = '))
# Pass the given list and number of rotations as arguments to the rightRotateList function
# which rotates the given list to the right by r positions.
rightRotateList(given_list, positions)
# print the list after rotating to the right r times
print('The list after rotating r times : ', given_list)

Output:

Enter some random list separated by spaces = 8 77 9 12 1 6 4 3 7 9
The list before rotating r times = [8, 77, 9, 12, 1, 6, 4, 3, 7, 9]
Enter some random number of positions = 4
The list after rotating r times : [4, 3, 7, 9, 8, 77, 9, 12, 1, 6]

The above solution has a time complexity of, where n is the size of the input and r is the number of rotations.

ii)String List

Approach:

  • Give the string list as user input using split(),list() functions.
  • Store it in a variable.
  • Give the number of rotations r as user input using int(input()) and store it in another variable.
  • Pass the given list and number of rotations as arguments to the rightRotateList function which rotates the given list to the right by r positions.
  • Use for loop to loop r times.
  • Pass the given list to the rightRotateOne function inside the for loop which rotates the list to the right one time.
  • Inside the rightRotateOne function follow the below steps.
  • Initialize the last variable to the last element of the given list.
  • Traverse length in reverse order of given list -1 times using for loop and reversed range functions.
  • Initialize the next index element to the current index element inside the For loop.
  • After the loop Initialize the first value of the given list to the last value.
  • In this way, we rotate the given list to the right r times.
  • The Exit of the Program.

Below is the implementation:

# function which accepts the giveen list as argument
# and rotates the given list to the right by one time


def rightRotateByOne(given_list):
    # intializing last variable to the last element of the given list
    lastval = given_list[-1]
    # traversing length of given list -1 times using for loop
    for i in reversed(range(len(given_list) - 1)):
      # initializing the next index element to the current index element
        given_list[i+1] = given_list[i]
    # intializing first value to the last value of the given list
    given_list[0] = lastval


# function which accepts the given list and number
# of positions as arguments and rotate the given list r times here r=positions
def rightRotateList(given_list, positions):
    # Pass the given list to the rightRotateOne function inside the
    # for loop which rotates the list to the right one time.
    for numb in range(positions):
        rightRotateByOne(given_list)


# Driver Code
#Give the string list as user input using split(),list() functions.
given_list = list( input('Enter some random list separated by spaces = ').split())
print('The list before rotating r times = ', given_list)
# Give the number of rotations r as user input using int(input())
# and store it in another variable.
positions = int(input('Enter some random number of positions = '))
# Pass the given list and number of rotations as arguments to the rightRotateList function
# which rotates the given list to the right by r positions.
rightRotateList(given_list, positions)
# print the list after rotating to the right r times
print('The list after rotating r times : ', given_list)

Output:

Enter some random list separated by spaces = good morning this is btechgeeks
The list before rotating r times = ['good', 'morning', 'this', 'is', 'btechgeeks']
Enter some random number of positions = 3
The list after rotating r times : ['this', 'is', 'btechgeeks', 'good', 'morning']

Related Programs:

Pandas drop row with nan – Pandas: Drop Rows With NaN/Missing Values in any or Selected Columns of Dataframe

Pandas Drop Rows With NaNMissing Values in any or Selected Columns of Dataframe

Pandas drop row with nan: Pandas provide several data structures and operations to manipulate data and time series. There might be instances in which some data can go missing and pandas use two values to denote the missing data namely None, NaN. You will come across what does None and Nan indicate. In this tutorial we will discuss the dropna() function, why is it necessary to remove rows which contain missing values or NaN, and different methods to drop rows with NaN or Missing values in any or selected column in the dataframe.

dropna() function

Pandas drop nan column: The dropna() function is used to analyze and drop rows or columns having NaN or missing values in different ways.

syntax:  DataFrameName.dropna(axis, how, thresh, subset, inplace)

Parameters:

1) axis: If the axis is 0 rows with missing or NaN values will be dropped else if axis=1 columns with NaN or missing values will be dropped.

2) how: how to take a string as a parameter ‘any’ or ‘all’.  ‘any’ is used if any NaN value is present otherwise ‘all’ is used if all values are NaN.

3) thresh: It tells the minimum amount of NaN values that is to be dropped.

4) inplace: If inplace is true chance will be made in the existing dataset otherwise changes will be made in different datasets.

The Necessity to remove NaN or Missing values

Delete rows with nan pandas: NaN stands for Not a Number. It is used to signify whether a particular cell contains any data or not. When we work on different datasets we found that there are some cells that may have NaN or missing values. If we work on that type of dataset then the chances are high that we do not get an accurate result. Hence while working on any dataset we check whether our datasets contain any missing values or not. If it contains NaN values we will remove it so as to get results with more accuracy.

How to drop rows of Pandas DataFrame whose value in a certain column is NaN or a Missing Value?

Drop rows with nan pandas: There are different methods to drop rows of Pandas Dataframe whose value is missing or Nan. All 4 methods are explained with enough examples so that you can better understand the concept and apply the conceptual knowledge to other programs on your own.

Method 1: Drop Rows with missing value / NaN in any column

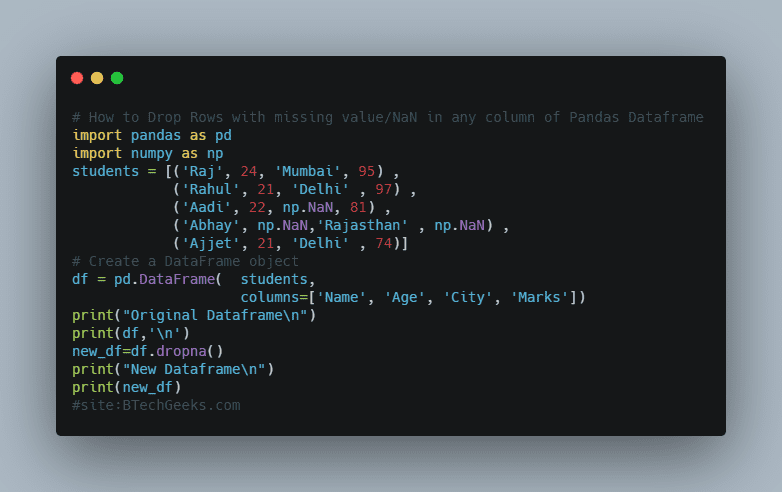
Pandas remove rows with nan: In this method, we will see how to drop rows with missing or NaN values in any column. As we know in all our methods dropna() function is going to be used hence we have to play with parameters. By default value of the axis is 0 and how is ‘any’ hence dropna() function without any parameter will going to be used to drop rows with missing or NaN values in any column. Let see this with the help of an example.

import pandas as pd
import numpy as np
students = [('Raj', 24, 'Mumbai', 95) ,
            ('Rahul', 21, 'Delhi' , 97) ,
            ('Aadi', 22, np.NaN, 81) ,
            ('Abhay', np.NaN,'Rajasthan' , np.NaN) ,
            ('Ajjet', 21, 'Delhi' , 74)]
# Create a DataFrame object
df = pd.DataFrame(  students, 
                    columns=['Name', 'Age', 'City', 'Marks'])
print("Original Dataframe\n")
print(df,'\n')
new_df=df.dropna()
print("New Dataframe\n")
print(new_df)

How to Drop Rows with missing valueNaN in any column of Pandas Dataframe

Output

Original Dataframe

    Name   Age       City  Marks
0    Raj  24.0     Mumbai   95.0
1  Rahul  21.0      Delhi   97.0
2   Aadi  22.0        NaN   81.0
3  Abhay   NaN  Rajasthan    NaN
4  Ajjet  21.0      Delhi   74.0 

New Dataframe

    Name   Age    City  Marks
0    Raj  24.0  Mumbai   95.0
1  Rahul  21.0   Delhi   97.0
4  Ajjet  21.0   Delhi   74.0

Here we see that we get only those rows that don’t have any NaN or missing value.

Method 2: Drop Rows in dataframe which has all values as NaN

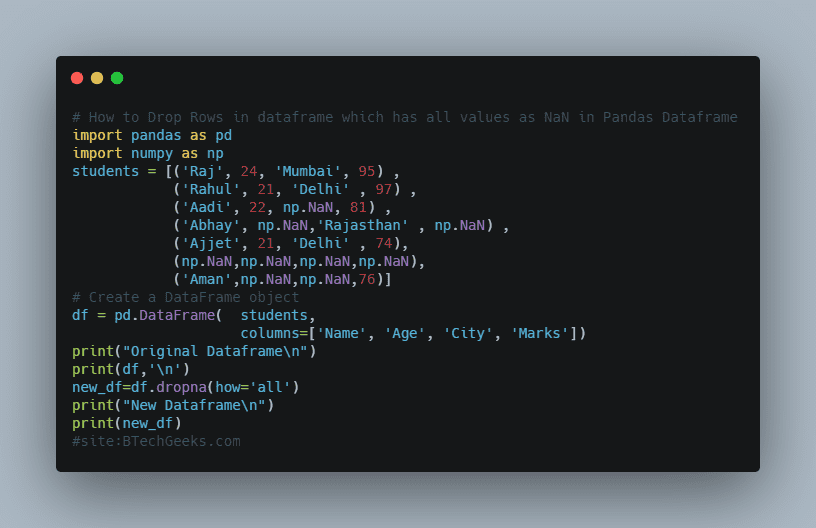
Pandas drop rows with nan in column: In this method, we have to drop only those rows in which all the values are NaN or missing. Hence we have to only pass how as an argument with value ‘all’ and all the parameters work with their default values. Let see this with an example.

import pandas as pd
import numpy as np
students = [('Raj', 24, 'Mumbai', 95) ,
            ('Rahul', 21, 'Delhi' , 97) ,
            ('Aadi', 22, np.NaN, 81) ,
            ('Abhay', np.NaN,'Rajasthan' , np.NaN) ,
            ('Ajjet', 21, 'Delhi' , 74),
            (np.NaN,np.NaN,np.NaN,np.NaN),
            ('Aman',np.NaN,np.NaN,76)]
# Create a DataFrame object
df = pd.DataFrame(  students, 
                    columns=['Name', 'Age', 'City', 'Marks'])
print("Original Dataframe\n")
print(df,'\n')
new_df=df.dropna(how='all')
print("New Dataframe\n")
print(new_df)


How to Drop Rows in dataframe which has all values as NaN in Pandas Dataframe

Output

Original Dataframe

    Name   Age       City  Marks
0    Raj  24.0     Mumbai   95.0
1  Rahul  21.0      Delhi   97.0
2   Aadi  22.0        NaN   81.0
3  Abhay   NaN  Rajasthan    NaN
4  Ajjet  21.0      Delhi   74.0
5    NaN   NaN        NaN    NaN
6   Aman   NaN        NaN   76.0 

New Dataframe

    Name   Age       City  Marks
0    Raj  24.0     Mumbai   95.0
1  Rahul  21.0      Delhi   97.0
2   Aadi  22.0        NaN   81.0
3  Abhay   NaN  Rajasthan    NaN
4  Ajjet  21.0      Delhi   74.0
6   Aman   NaN        NaN   76.0

Here we see that row 5 is dropped because it has all the values as NaN.

Method 3: Drop Rows with any missing value in selected columns only

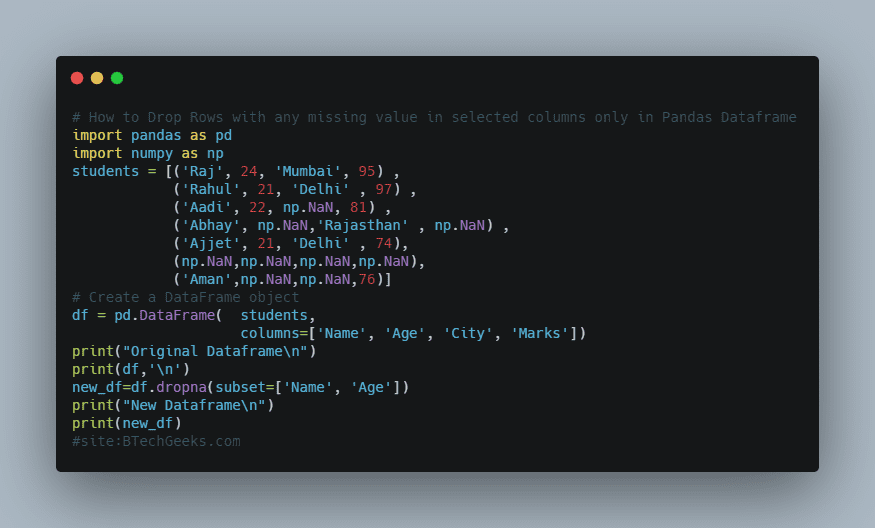
Remove nan rows pandas: In this method, we see how to drop rows with any of the NaN values in the selected column only. Here also axis and how to take default value but we have to give a list of columns in the subset in which we want to perform our operation. Let see this with the help of an example.

import pandas as pd
import numpy as np
students = [('Raj', 24, 'Mumbai', 95) ,
            ('Rahul', 21, 'Delhi' , 97) ,
            ('Aadi', 22, np.NaN, 81) ,
            ('Abhay', np.NaN,'Rajasthan' , np.NaN) ,
            ('Ajjet', 21, 'Delhi' , 74),
            (np.NaN,np.NaN,np.NaN,np.NaN),
            ('Aman',np.NaN,np.NaN,76)]
# Create a DataFrame object
df = pd.DataFrame(  students, 
                    columns=['Name', 'Age', 'City', 'Marks'])
print("Original Dataframe\n")
print(df,'\n')
new_df=df.dropna(subset=['Name', 'Age'])
print("New Dataframe\n")
print(new_df)

How to Drop Rows with any missing value in selected columns only in Pandas Dataframe

Output

Original Dataframe

    Name   Age       City  Marks
0    Raj  24.0     Mumbai   95.0
1  Rahul  21.0      Delhi   97.0
2   Aadi  22.0        NaN   81.0
3  Abhay   NaN  Rajasthan    NaN
4  Ajjet  21.0      Delhi   74.0
5    NaN   NaN        NaN    NaN
6   Aman   NaN        NaN   76.0 

New Dataframe

    Name   Age    City  Marks
0    Raj  24.0  Mumbai   95.0
1  Rahul  21.0   Delhi   97.0
2   Aadi  22.0     NaN   81.0
4  Ajjet  21.0   Delhi   74.0

Here we see in rows 3,5 and 6 columns ‘Name’ and ‘Age’ has NaN or missing values so these columns are dropped.

Method 4: Drop Rows with missing values or NaN in all the selected columns

Pandas remove nan rows: In this method we see how to drop rows that have all the values as NaN or missing values in a select column i.e if we select two columns ‘A’ and ‘B’ then both columns must have missing values. Here we have to pass a list of columns in the subset and ‘all’ in how. Let see this with the help of an example.

import pandas as pd
import numpy as np
students = [('Raj', 24, 'Mumbai', 95) ,
            ('Rahul', 21, 'Delhi' , 97) ,
            ('Aadi', 22, np.NaN, 81) ,
            ('Abhay', np.NaN,'Rajasthan' , np.NaN) ,
            ('Ajjet', 21, 'Delhi' , 74),
            (np.NaN,np.NaN,np.NaN,np.NaN),
            ('Aman',np.NaN,np.NaN,76)]
# Create a DataFrame object
df = pd.DataFrame(  students, 
                    columns=['Name', 'Age', 'City', 'Marks'])
print("Original Dataframe\n")
print(df,'\n')
new_df=df.dropna(how='all',subset=['Name', 'Age'])
print("New Dataframe\n")
print(new_df)

How to Drop Rows with missing values or NaN in all the selected columns in Pandas Dataframe

Output

Original Dataframe

    Name   Age       City  Marks
0    Raj  24.0     Mumbai   95.0
1  Rahul  21.0      Delhi   97.0
2   Aadi  22.0        NaN   81.0
3  Abhay   NaN  Rajasthan    NaN
4  Ajjet  21.0      Delhi   74.0
5    NaN   NaN        NaN    NaN
6   Aman   NaN        NaN   76.0 

New Dataframe

    Name   Age       City  Marks
0    Raj  24.0     Mumbai   95.0
1  Rahul  21.0      Delhi   97.0
2   Aadi  22.0        NaN   81.0
3  Abhay   NaN  Rajasthan    NaN
4  Ajjet  21.0      Delhi   74.0
6   Aman   NaN        NaN   76.0

Here we see that only row 7 has NaN value in both the columns hence it is dropped, while row 3 and row 6 have NaN value only in the age column hence it is not dropped.

So these are the methods to drop rows having all values as NaN or selected value as NaN.

Want to expert in the python programming language? Exploring Python Data Analysis using Pandas tutorial changes your knowledge from basic to advance level in python concepts.

Read more Articles on Python Data Analysis Using Pandas – Remove Contents from a Dataframe

Map function pandas – Python Pandas Series map() Function

Python Pandas Series map() Function

Pandas Series map() Function:

Map function pandas: The map() function of the Pandas Series is used to replace each value in a Series with another value taken from a function, a dictionary, or another Series.

Syntax:

Series.map(arg, na_action=None)

Parameters

arg: This is optional. It indicates a mapping correspondence. It could be a function, a dictionary, or a Series.

na_action: This is optional. If set to ‘ignore,’ NaN values are propagated without being passed to the mapping correspondence. This can take the values from {None, ‘ignore’}. The default value is None.

Return Value:

A Series whose index is the same as the caller’s is returned by the map() function of the Pandas Series

Pandas Series map() Function in Python

Example1

Here, the map() function is used to replace each value in the given Series with the value specified in the given dictionary argument.

Approach:

  • Import pandas module using the import keyword.
  • Import numpy module using the import keyword.
  • Pass some random list as an argument to the Series() function of the pandas module to create a series.
  • Store it in a variable.
  • Print the above given series
  • Pass the values to be mapped as key-value pairs of a dictionary to map() function and print the result.
  • The Exit of the Program.

Below is the implementation:

# Import pandas module using the import keyword.
import pandas as pd
# Import numpy module using the import keyword.
import numpy as np
# Pass some random list as an argument to the Series() function
# of the pandas module to create a series.
# Store it in a variable.
gvn_series = pd.Series(['fruits', 'vegetables', np.NaN, 'cereals', 'clothes'])
# Print the above given series
print("The given series is:")
print(gvn_series)
print()
# Pass the values to be mapped as key-value pairs of a dictionary to map()
# function and print the result.
print("Mapping fruits with 'Apple' and vegetables with 'Brinjal' of the series:")
print(gvn_series.map({'fruits': 'Apple', 'vegetables': 'Brinjal'}))

Output:

The given series is:
0        fruits
1    vegetables
2           NaN
3       cereals
4       clothes
dtype: object

Mapping fruits with 'Apple' and vegetables with 'Brinjal' of the series:
0      Apple
1    Brinjal
2        NaN
3        NaN
4        NaN
dtype: object

Example2: With the function argument

The map() function can also take a function as an argument.

Approach:

  • Import pandas module using the import keyword.
  • Pass some random list as an argument to the Series() function of the pandas module to create a series.
  • Store it in a variable.
  • Print the above given series
  • Format the given series to some random text format using the map() function, format attribute and print the result.
  • The Exit of the Program.

Below is the implementation:

# Import pandas module using the import keyword.
import pandas as pd
# Pass some random list as an argument to the Series() function
# of the pandas module to create a series.
# Store it in a variable.
gvn_series = pd.Series(['fruits', 'vegetables', np.NaN, 'cereals', 'clothes'])
# Print the above given series
print("The given series is:")
print(gvn_series)
print()
# Format the given series to some random text format using the map()
# function, format attribute and print the result.
print("Formatting the given series to some random text format:")
print(gvn_series.map('These are {}'.format))

Output:

The given series is:
0        fruits
1    vegetables
2           NaN
3       cereals
4       clothes
dtype: object

Formatting the given series to some random text format:
0        These are fruits
1    These are vegetables
2           These are nan
3       These are cereals
4       These are clothes
dtype: object

Example3: With na_action parameter

If the na_action parameter is set to ‘ignore,’ this function will propagate NaN values without transmitting them to the mapping correspondence.

Approach:

  • Import pandas module using the import keyword.
  • Pass some random list as an argument to the Series() function of the pandas module to create a series.
  • Store it in a variable.
  • Print the above given series
  • Format the given series to some random text format using the map() function, format attribute and print the result.
  • Format the given series to some random text format using the map() function, format attribute ignoring all the Nan values using the ‘ignore’ argument and print the result.
  • The Exit of the Program.

Below is the implementation:

# Import pandas module using the import keyword.
import pandas as pd
# Pass some random list as an argument to the Series() function
# of the pandas module to create a series.
# Store it in a variable.
gvn_series = pd.Series(['fruits', 'vegetables', np.NaN, 'cereals', 'clothes'])
# Print the above given series
print("The given series is:")
print(gvn_series)
print()
# Format the given series to some random text format using the map()
# function, format attribute and print the result.
print("Formatting the given series to some random text format:")
print(gvn_series.map('These are {}'.format))
print()
# Format the given series to some random text format using the map()
# function, format attribute ignoring all the Nan values using the 
# 'ignore' argument and print the result.
print("Formatting the given series to random format ignoring all the Nan values:")
print(gvn_series.map('These are {}'.format,  'ignore'))

Output:

The given series is:
0        fruits
1    vegetables
2           NaN
3       cereals
4       clothes
dtype: object

Formatting the given series to some random text format:
0        These are fruits
1    These are vegetables
2           These are nan
3       These are cereals
4       These are clothes
dtype: object

Formatting the given series to random format ignoring all the Nan values:
0        These are fruits
1    These are vegetables
2                     NaN
3       These are cereals
4       These are clothes
dtype: object


Smallest value of the rearranged number – Python Program to Rearrange the given Number to form the Smallest Number

Program to Rearrange the given Number to form the Smallest Number

Smallest value of the rearranged number: In Python, we will write a program that will rearrange the digits of a given number to produce the smallest possible number. We will rearrange the number so that it creates the smallest possible number with the number and the number digits being the same as the given number.

Examples:

Example1:

Input:

Given number =17831047264891

Output:

The smallest number that can be formed from 17831047264891 is [ 10112344677889 ]

Example2:

Input:

Given number =4851381128859729830005768

Output:

The smallest number that can be formed from 4851381128859729830005768 is [ 1000112233455567788888899 ]

Program to Rearrange the given Number to form the Smallest Number

Below are the ways to rearrange the given Number to form the smallest Number in Python.

Beginners and experienced programmers can rely on these Best Java Programs Examples and code various basic and complex logics in the Java programming language with ease.

Method #1: Using Sorting (Static Input)

Approach:

  • Give the number as static input and store it in a variable.
  • Convert the given number to a string and sort it.
  • After sorting join it using the join() function.
  • Count the number of 0’s present in this number using the count() function and store it in a variable say m.
  • Convert the given number to a list of digits using the list() function.
  • Swap the first index digit and mth index digit in the list using ‘,’ operator.
  • Join the list into the string using the join() function.
  • Print the result.
  • The Exit of the Program.

Below is the implementation:

# Give the number as static input and store it in a variable.
numb = 17831047264891
# Convert the given number to a string and sort it.
strnumb = str(numb)
strnumb = sorted(strnumb)
# After sorting join it using the join() function.
sortednumb = ''.join(strnumb)
# Count the number of 0's present in this number
# using the count() function and store it in a variable say m.
m = sortednumb.count('0')
# Convert the given number to a list of digits using the list() function.
numbdigi = list(sortednumb)
# Swap the first index digit and mth index digit in the list using ',' operator.
numbdigi[0], numbdigi[m] = numbdigi[m], numbdigi[0]
# Join the list into the string using the join() function.
finalres = ''.join(numbdigi)
# Print the result
print('The smallest number that can be formed from',
      numb, 'is [', finalres, ']')

Output:

The smallest number that can be formed from 17831047264891 is [ 10112344677889 ]

Method #2: Using Sorting (User Input)

Approach:

  • Give the number as user input using int(input()) and store it in a variable.
  • Convert the given number to a string and sort it.
  • After sorting join it using the join() function.
  • Count the number of 0’s present in this number using the count() function and store it in a variable say m.
  • Convert the given number to a list of digits using the list() function.
  • Swap the first index digit and mth index digit in the list using ‘,’ operator.
  • Join the list into the string using the join() function.
  • Print the result.
  • The Exit of the Program.

Below is the implementation:

# Give the number as user input using int(input()) and store it in a variable.
numb = int(input('Enter some random number = '))
# Convert the given number to a string and sort it.
strnumb = str(numb)
strnumb = sorted(strnumb)
# After sorting join it using the join() function.
sortednumb = ''.join(strnumb)
# Count the number of 0's present in this number
# using the count() function and store it in a variable say m.
m = sortednumb.count('0')
# Convert the given number to a list of digits using the list() function.
numbdigi = list(sortednumb)
# Swap the first index digit and mth index digit in the list using ',' operator.
numbdigi[0], numbdigi[m] = numbdigi[m], numbdigi[0]
# Join the list into the string using the join() function.
finalres = ''.join(numbdigi)
# Print the result
print('The smallest number that can be formed from',
      numb, 'is [', finalres, ']')

Output:

Enter some random number = 4851381128859729830005768
The smallest number that can be formed from 4851381128859729830005768 is [ 1000112233455567788888899 ]

Time Complexity: O(N log N) where N is the number len of the number.
Related Programs:

Converting 1d array to 2d array – Python: Convert a 1D array to a 2D Numpy array or Matrix

Python Convert a 1D array to a 2D Numpy array or Matrix

Python NumPy is the ultimate package in a python programming language that includes multidimensional array objects and a set of operations or routines to execute various operations on the array and process of the array. Where this numpy package is comprised of a function known as numpy.reshape() that performs converting a 1D array into a 2-D array of required dimensions (n x m). This function gives a new required shape without changing the data of the 1-D array.

This tutorial of Convert a 1D array to a 2D Numpy array or Matrix in Python helps programmers to learn the concept precisely and implement the logic in required situations. However, you can also learn how to construct the 2D array row-wise and column-wise, from a 1D array from this tutorial.

How to convert a 1D array to a 2D Numpy array or Matrix in Python

Converting 1d array to 2d array: In this section, python learners will find the correct explanation on how to convert a 1D Numpy array to a 2D Numpy array or matric with the help of reshape() function.

One dimensional array contains elements only in one dimension.

program to convert a 1D array to a 2D Numpy array or Matrix in Python

Let’s try with an example:

#program

#import required libraries
import pandas as pd
import numpy as np
#create 1D numpy array
arr= np.array([2,3,1,8,6,4,7,0,9,5])
print(arr)
Output :
[2 3 1 8 6 4 7 0 9 5]

Now we will convert it into a 2D array of shape 5X2 i.e 5 rows and 2 columns like shown below:

[[0 1 2 3 4]
[5 6 7 8 9]]

Reshape 1D array to 2D array

First, import the numpy module,

import numpy as np

Program to Reshape 1D array to 2D array

Now to change the shape of the numpy array, we will use the reshape() function of the numpy module,

#Program:Reshape 1D array to 2D array

#import required libraries
import pandas as pd
import numpy as np
#create 1D numpy array
arr= np.array([2,3,1,8,6,4,7,0,9,5])
newarr = arr.reshape(5,2)
print(newarr)

Output:

[[2 3]
 [1 8]
 [6 4]
 [7 0]
 [9 5]]

First, we import the numpy module and then passed the 1D array as the first argument and the new shape i.e a tuple (5,2) as the second argument. It returned the 2D array.

Note: The new shape of the array must be compatible with the original shape of the input array, if not then it will raise ValueError.

numpy.reshape() function

  • It is used to give a new shape to an array without changing its data.
  • It returns the new view object(if possible, otherwise returns a copy) of the new shape.

Reshaped 2D array in view of a 1D array

If possible the function returns a view of the original and any modification in the view object will also affect the original input array.

Program to Reshaped 2D array in view of a 1D array

Example:

#Program:Reshaped 2D array in view of a 1D array

import pandas as pd
import numpy as np
arr_1 = np.array[2, 7, 5, 9, 1, 0, 8, 3]
arr_2 = np.reshape(arr_1, (2, 4))
aar_2[0][0] = 88
print(‘1D array:’)
print(arr_1)
print(‘2D array’)
print(arr_2)

Output:

1D array:
[88 7 5 9 1 0 8 3]
2D array:
[[88 7 5 9]
[ 1 0 8 3]]

Convert a 1D numpy array to a 3D numpy array using numpy.reshape()

In case, we have 12 elements in a 1D numpy array,

arr = np.array([1, 2, 3, 4, 5, 6, 7, 8, 9, 10, 11, 12])

Program to Convert a 1D numpy array to a 3D numpy array using numpy.reshape()

Now, let’s convert this 1D numpy array to a 3D numpy array:

#Program:Convert a 1D numpy array to a 3D numpy array using numpy.reshape()

import pandas as pd
import numpy as np
arr = np.array([2,3,1,8,6,4,7,0,9,5,11,34])
arr_3 = np.reshape(arr,(2,2,3))
print(‘3D array:’)
print(arr_3)

Output:

3D array:
[[[2 3 1]
[8 6 4]]
[[7 0 9]
[5 11 34]]]

Here, the first argument is a 1D array and the second argument is the tuple (2, 2, 3).

It returned a 3D view of the passed array.

Convert 1D numpy array to a 2D numpy array along the column

After converting a 1D array to a 2D array or matrix in the above example, the items from the input array will be shown row-wise i.e.

  • 1st row of a 2D array was created from items at index 0 to 2 in the input array
  • 2nd row of a 2D array was created from items at index 3 to 5 in the input array
  • 3rd row of a 2D array was created from items at index 6 to 8 in the input array

Now suppose we want to convert a 2D array column-wise so we have to pass the order parameter as ‘F’ in the reshape() function.

Program to Convert 1D Numpy array to a 3D array with 2 matrices of shape 2X3

#Program:Convert 1D Numpy array to a 3D array with 2 matrices of shape 2X3

import pandas as pd 
import numpy as np
arr = np.array([2,3,1,8,6,4,7,0,9,5])
arr_2 = np.reshape(arr,(2,5),order=’F’)
print(‘2D numpy array’)
print(arr_2)
Output:
2D numpy array:
[[0 2 4 6 8]
 [1 3 5 7 9]]

Convert 2D array to 1D array as Copy

Suppose we want to create a 2D copy of the 1D numpy array then use the copy() function along with reshape() function.

Python Program to Convert 2D array to 1D array as Copy

Let’s try with an example:

#Program:Convert 2D array to 1D array as Copy

import pandas as pd 
import numpy as np
arr_1 = np.array[2, 7, 5, 9, 1, 0, 8, 3]
arr_2 = np.reshape(arr_1, (2, 4).copy())
#modify the 2D array that will not affect the original array
aar_2[0][0] = 88
print(‘1D array:’)
print(arr_1)
print(‘2D array’)
print(arr_2)

Output:

1D array:
[2 7 5 9 1 0 8 3]
2D array:
[[88 7 5 9]
 [ 1 0 8 3]]

Here, the 2D array is created of the 1D array. If you want to change the 2D array without changing the original array, just use the copy() function and the reshape() function.

Pandas barh – Python Pandas DataFrame plot.barh() Function

Pandas DataFrame plot.barh() Function

Pandas barh: A bar plot (or bar chart) is a type of graph that displays categorical data using rectangular bars with heights or lengths proportionate to the values they represent. The bars can be plotted horizontally or vertically.

The ability to fast and effectively generate a bar chart from data in Pandas DataFrames is essential for any Python data scientist.

Nothing beats a bar chart for quick data exploration and comparison of variable values between groups, or for developing a storyline around how data groupings are created. At EdgeTier, we frequently end up with an overabundance of bar charts in both exploratory data analysis work and dashboard visualisations.

The advantage of bar charts (also known as “bar plots” or “column charts”) over other chart styles is that the human eye has acquired a refined ability to compare object length rather than angle or area.

Pandas DataFrame plot.barh() Function:

Plot barh: A horizontal bar plot is created using the DataFrame.plot.barh() function. A bar plot depicts comparisons between discrete categories. The plot’s one axis depicts the particular categories being compared, while the other axis indicates a measured value.

Syntax:

DataFrame.plot.barh(x=None, y=None, **kwargs)

Parameters

x: This is optional. It indicates the label or position. It allows for the plotting of one column versus another. If no index is provided, the DataFrame’s index is taken.

y: This is optional. It indicates the label or position. It allows for the plotting of one column versus another. If no index is provided, all numerical columns are utilized.

**kwargs: This is required. It represents the additional keyword arguments.

Return Value:

matplotlib.axes.Axes or a ndarray is returned containing one matplotlib.axes.Axes per column when subplots=True.

Pandas DataFrame plot.barh() Function in Python

Example1

Approach:

  • Import pandas module using the import keyword.
  • Import pyplot function of the matplotlib module using the import keyword.
  • Pass some random key-value pair(dictionary), index list as arguments to the DataFrame() function of the pandas module to create a dataframe.
  • Store it in a variable.
  • Print the given dataframe.
  • Plot the horizontal bar graph of the firstyear_marks column of the given dataframe using the dataframe.plot.barh() function
  • Display the plot using the show() function of the matplotlib module.
  • The Exit of the Program.

Below is the implementation:

# Import pandas module using the import keyword.
import pandas as pd
# Import pyplot function of the matplotlib module using the import keyword.
import matplotlib.pyplot as plt
# Pass some random key-value pair(dictionary), index list as arguments to the 
# DataFrame() function of the pandas module to create a dataframe
# Store it in a variable.
data_frme = pd.DataFrame({
  "firstyear_marks": [71, 60, 35, 85],
  "secondyear_marks": [80, 40, 25, 90],
  "thirdyear_marks": [90, 73, 68, 80],
  "fourthyear_marks": [75, 80, 55, 95]},
  
  index= ["virat", "nick" , "jessy", "sindhu"]
)
# Print the given dataframe
print("The given Dataframe:")
print(data_frme)
print()

# Plot the horizontal bar graph of the firstyear_marks column of the
# given dataframe using the dataframe.plot.barh() function 
data_frme.plot.barh(y=['firstyear_marks'], rot=0)

# Display the plot using the show() function of the matplotlib module 
plt.show()

Output:

The given Dataframe:
        firstyear_marks  secondyear_marks  thirdyear_marks  fourthyear_marks
virat                71                80               90                75
nick                 60                40               73                80
jessy                35                25               68                55
sindhu               85                90               80                95

Example2

Pandas barh: Here, the horizontal bar plot is plotted for the selected columns i.e, firstyear_marks,  secondyear_marks of the given dataframe.

Approach:

  • Import pandas module using the import keyword.
  • Import pyplot function of the matplotlib module using the import keyword.
  • Pass some random key-value pair(dictionary), index list as arguments to the DataFrame() function of the pandas module to create a dataframe.
  • Store it in a variable.
  • Print the given dataframe.
  •  Plot the horizontal bar graph of the firstyear_marks, secondyear_marks columns of the given dataframe using the dataframe.plot.barh() function by passing the argument as a list.
  • Display the plot using the show() function of the matplotlib module.
  • The Exit of the Program.

Below is the implementation:

# Import pandas module using the import keyword.
import pandas as pd
# Import pyplot function of the matplotlib module using the import keyword.
import matplotlib.pyplot as plt
# Pass some random key-value pair(dictionary), index list as arguments to the 
# DataFrame() function of the pandas module to create a dataframe
# Store it in a variable.
data_frme = pd.DataFrame({
  "firstyear_marks": [71, 60, 35, 85],
  "secondyear_marks": [80, 40, 25, 90],
  "thirdyear_marks": [90, 73, 68, 80],
  "fourthyear_marks": [75, 80, 55, 95]},
  
  index= ["virat", "nick" , "jessy", "sindhu"]
)
# Print the given dataframe
print("The given Dataframe:")
print(data_frme)
print()

# Plot the horizontal bar graph of the firstyear_marks, secondyear_marks columns
# of the given dataframe using the dataframe.plot.barh() function by passing the
# argument as a list
data_frme.plot.barh(y=['firstyear_marks', 'secondyear_marks'], rot=0)

# Display the plot using the show() function of the matplotlib module 
plt.show()

Output:

The given Dataframe:
        firstyear_marks  secondyear_marks  thirdyear_marks  fourthyear_marks
virat                71                80               90                75
nick                 60                40               73                80
jessy                35                25               68                55
sindhu               85                90               80                95

Example3

A stack bar plot can be constructed by specifying the stacked=True argument.

Approach:

  • Import pandas module using the import keyword.
  • Import pyplot function of the matplotlib module using the import keyword.
  • Pass some random key-value pair(dictionary), index list as arguments to the DataFrame() function of the pandas module to create a dataframe.
  • Store it in a variable.
  • Print the given dataframe.
  • Plot the horizontal bar graph of all the 4 years marks(columns) of students of the given dataframe using the dataframe.plot.barh() function by passing stacked=True as argument.
  • Display the plot using the show() function of the matplotlib module.
  • The Exit of the Program.

Below is the implementation:

# Import pandas module using the import keyword.
import pandas as pd
# Import pyplot function of the matplotlib module using the import keyword.
import matplotlib.pyplot as plt
# Pass some random key-value pair(dictionary), index list as arguments to the 
# DataFrame() function of the pandas module to create a dataframe
# Store it in a variable.
data_frme = pd.DataFrame({
  "firstyear_marks": [71, 60, 35, 85],
  "secondyear_marks": [80, 40, 25, 90],
  "thirdyear_marks": [90, 73, 68, 80],
  "fourthyear_marks": [75, 80, 55, 95]},
  
  index= ["virat", "nick" , "jessy", "sindhu"]
)
# Print the given dataframe
print("The given Dataframe:")
print(data_frme)
print()

# Plot the horizontal bar graph of all the 4 year marks(colmns) of the students 
# of the given dataframe using the dataframe.plot.barh() function by passing
# stacked=True as argument.
data_frme.plot.barh(rot=0, stacked=True)

# Display the plot using the show() function of the matplotlib module 
plt.show()

Output:

The given Dataframe:
        firstyear_marks  secondyear_marks  thirdyear_marks  fourthyear_marks
virat                71                80               90                75
nick                 60                40               73                80
jessy                35                25               68                55
sindhu               85                90               80                95

Example4

Here, the bar graph(horizontal) is split column-wise by using the subplots=True argument.

Approach:

  • Import pandas module using the import keyword.
  • Import pyplot function of the matplotlib module using the import keyword.
  • Pass some random key-value pair(dictionary), index list as arguments to the DataFrame() function of the pandas module to create a dataframe.
  • Store it in a variable.
  • Print the given dataframe.
  • Plot the horizontal bar graph of the firstyear_marks, secondyear_marks of the students of the given dataframe using the dataframe.plot.barh() function by passing the argument as a list, and subplots=True.
  • Here, the horizontal bar graph is split column-wise by using the subplots=True argument
  • Display the plot using the show() function of the matplotlib module.
  • The Exit of the Program.

Below is the implementation:

# Import pandas module using the import keyword.
import pandas as pd
# Import pyplot function of the matplotlib module using the import keyword.
import matplotlib.pyplot as plt
# Pass some random key-value pair(dictionary), index list as arguments to the 
# DataFrame() function of the pandas module to create a dataframe
# Store it in a variable.
data_frme = pd.DataFrame({
  "firstyear_marks": [71, 60, 35, 85],
  "secondyear_marks": [80, 40, 25, 90],
  "thirdyear_marks": [90, 73, 68, 80],
  "fourthyear_marks": [75, 80, 55, 95]},
  
  index= ["virat", "nick" , "jessy", "sindhu"]
)
# Print the given dataframe
print("The given Dataframe:")
print(data_frme)
print()

# Plot the horizontal bar graph of the firstyear_marks, secondyear_marks of the students 
# of the given dataframe using the dataframe.plot.barh() function by passing the
# argument as a list, and subplots=True.
# Here, the horizontal bar graph is split column-wise by using the subplots=True argument
data_frme.plot.barh(y=['firstyear_marks', 'secondyear_marks'], rot=0, subplots=True)

# Display the plot using the show() function of the matplotlib module 
plt.show()

Output:

The given Dataframe:
        firstyear_marks  secondyear_marks  thirdyear_marks  fourthyear_marks
virat                71                80               90                75
nick                 60                40               73                80
jessy                35                25               68                55
sindhu               85                90               80                95

Python print key and value – Python: Print Specific Key-Value Pairs of Dictionary

Print Specific Key-Value Pairs of Dictionary

Python print key value pairs: Dictionaries are Python’s implementation of an associative list, which may be a arrangement . A dictionary may be a collection of key-value pairs that are stored together. A key and its value are represented by each key-value pair.

Given a dictionary, the task is to print specific key-value pairs of the Dictionary.

Display Specific Key-Value Pairs of Dictionary

Indexing:

Python print key and value: Dictionary’s items() function returns an iterable sequence of dictionary key-value pairs, i.e. dict items. However, this is a view-only sequence, and we cannot use indexing on it. So, if we want to use indexing to select items from a dictionary, we must first create a list of pairs from this sequence.

We can convert dictionary items to list using list() function

Below is the implementation:

# Given dictionary
dictionary = {'this': 200, 'is': 100, 'BTechGeeks': 300}
# convert the dictionary to list using items()
dictlist = list(dictionary.items())
# using indexing we can print the first key value pair of dictionary
print("1st key value pair :", dictlist[0])

Output:

1st key value pair : ('this', 200)

How to get specific key, value from dictionary in python: We can print last key value pair of dictionary using negative indexing(-1) or using length function of list.

Below is the implementation:

# Given dictionary
dictionary = {'this': 200, 'is': 100, 'BTechGeeks': 300}
# convert the dictionary to list using items()
dictlist = list(dictionary.items())
# using indexing we can print the last key value pair of dictionary
print("last key value pair :", dictlist[-1])

Output:

last key value pair : ('BTechGeeks', 300)

Print key and value of dictionary python: We can print nth key-value pair using indexing

Below is the implementation:

# Given dictionary
dictionary = {'this': 200, 'is': 100, 'BTechGeeks': 300}
# given n
n = 2
# convert the dictionary to list using items()
dictlist = list(dictionary.items())
# using indexing we can print the nth key value pair of dictionary
print("nth key value pair :", dictlist[n-1])

Output:

nth key value pair : ('is', 100)

4)Printing specific key-value pairs based on given conditions

Print key and value python: To print specific dictionary items that satisfy a condition, we can iterate over all dictionary pairs and check the condition for each pair. If the condition returns True, then print the pair otherwise, skip it.

Let us print all the key-value pairs whose value is greater than 100

Below is the implementation:

# Given dictionary
dictionary = {'this': 200, 'is': 100, 'BTechGeeks': 300}
# convert the dictionary to list using items()
dictlist = list(dictionary.items())
# Traverse the dictionary
for key, value in dictionary.items():
    # if the value is greater than 100 then print it
    if(value > 100):
        print(key, value)

Output:

this 200
BTechGeeks 300

Related Programs:

Clear a bit in c – Program to Clear the Rightmost Set Bit of a Number in C++ and Python

Program to Clear the Rightmost Set Bit of a Number in C++ and Python


Clear a bit in c:
In the previous article, we have discussed about C++ Program to Check if it is Sparse Matrix or Not. Let us learn Program to Clear the Rightmost Set Bit of a Number in C++ Program and Python.

Binary Representation of a Number:

Binary is a base-2 number system in which a number is represented by two states: 0 and 1. We can also refer to it as a true and false state. A binary number is constructed in the same way that a decimal number is constructed.

Examples:

Examples1:

Input:

given number=19

Output:

The given number before removing right most set bit : 
19
The given number after removing right most set bit : 
18

Examples2:

Input:

given number =18

Output:

The given number before removing right most set bit : 
18
The given number after removing right most set bit : 
16

Examples3:

Input:

given number=512

Output:

The given number before removing right most set bit : 
512
The given number after removing right most set bit : 
0

Program to Clear the Rightmost Set Bit of a Number in C++ and Python

There are several ways to clear the rightmost set Bit of a Number in C++ and Python some of them are:

Drive into Python Programming Examples and explore more instances related to python concepts so that you can become proficient in generating programs in Python Programming Language.

Method #1: Using Bitwise Operators in C++

Approach:

  • There is a function called clear rightmost set bit that is defined.
  • It accepts n as an argument and returns n with its rightmost set bit cleared.
  • This is accomplished by computing n & (n – 1) and returning the result.
  • (n – 1) equals n when all the rightmost successive 0s are flipped and the initial rightmost 1 is flipped.
  • As a result, n & (n – 1) equals n with the rightmost 1 cleared.

Below is the implementation of above approach:

#include <bits/stdc++.h>
using namespace std;
// function which removes the right most set bit in the
// given number
int clearRight(int numb)
{
    // clearing the right most set bit from
    // the given number and store it in the result
    int reslt = (numb) & (numb - 1);
    // returing the calculated result
    return reslt;
}

// main function
int main()
{
    // given number
    int numb = 19;

    cout << "The given number before removing right most "
            "set bit : "
         << numb << endl;
    // passing the given number to clearRight function
    // to remove the clear the rightmost setbit
    cout << "The given number after removing right most "
            "set bit : "
         << clearRight(numb) << endl;
    return 0;
}

Output:

The given number before removing right most set bit : 19
The given number after removing right most set bit : 18

Method #2: Using Bitwise Operators in Python

Approach:

  • There is a function called clear rightmost set bit that is defined.
  • It accepts n as an argument and returns n with its rightmost set bit cleared.
  • This is accomplished by computing n & (n – 1) and returning the result.
  • (n – 1) equals n when all the rightmost successive 0s are flipped and the initial rightmost 1 is flipped.
  • As a result, n & (n – 1) equals n with the rightmost 1 cleared.
  • We will implement the same function in python

Below is the implementation:

# function which removes the right most set bit in the
# given number


def clearRight(numb):
    # clearing the right most set bit from
    # the given number and store it in the result
    reslt = (numb) & (numb - 1)
    # returing the calculated result
    return reslt
# Driver Code


# given number
numb = 19

print("The given number before removing right most "
      "set bit : ")
print(numb)
# passing the given number to clearRight function
# to remove the clear the rightmost setbit
print("The given number after removing right most set bit : ")
print(clearRight(numb))

Output:

The given number before removing right most set bit : 
19
The given number after removing right most set bit : 
18

Related Programs: