
Data warehousing concepts interview questions: We have compiled most frequently asked SQL Server Interview Questions which will help you with different expertise levels.
SQL Server Interview Questions on Data Warehousing/Data Mining
Note: -  "Data mining" and "Data Warehousing" are concepts that are very wide and it's beyond the scope
              of this book to discuss it in depth. So if you are especially looking for a "Data mining/warehousing" job it's
             better to go through some reference books. But below questions can shield you to some good limits.
Question 1.
What is “Data Warehousing”?
Answer:
“Data Warehousing “is a process in which the data is stored and accessed from a central location and is meant to support some strategic decisions. “Data Warehousing” is not a requirement for “Data mining”. But just makes your Data mining process more efficient.
A data warehouse is a collection of integrated, subject-oriented databases designed to support the decision-support functions (DSF), where each unit of data is relevant to some moment in time.
Question 2.
What are Data Marts?
Answer:
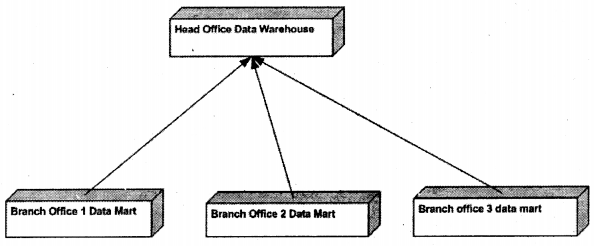
Data Marts are smaller sections of Data Warehouses. They help data warehouses collect data. For example, your company has a lot of branches which are spanned across the globe. Head- office of the company decides to collect data from all these branches for anticipating the market. So to achieve this IT department can set up a data mart in all branch offices and a central data warehouse where all data will finally reside.
Question 3.
What are Fact Tables and Dimension Tables?
Answer:
Twist: – What is Dimensional Modeling?
Twist: – What is Star Schema Design?
When we design a transactional database we always think in terms of normalizing design to its least form. But when it comes to designing for a Data warehouse we think more in terms of “denormalizing” the database. Data warehousing databases are designed using “Dimensional Modeling”. Dimensional Modeling uses the existing relational database structure and builds on that.
There are two basic tables in dimensional modeling:-
- Fact Tables.
- Dimension Tables.
Fact tables are central tables in data warehousing. Fact tables have the actual aggregate values which will be needed in a business process. While dimension tables revolve around fact tables. They describe the attributes of the fact tables. Let’s try to understand these two conceptually.
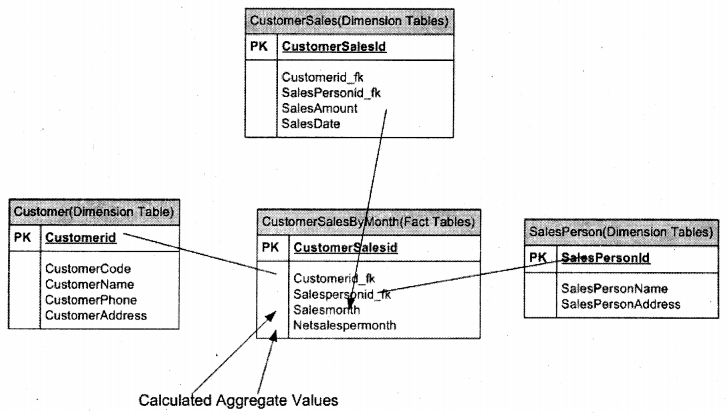
In the above example we have three tables which are transactional tables:-
- Customer: – It has the customer information details.
- Salesperson: – Salesperson who are actually selling products to customers.
- customer sales: – This table has data of which salesperson sold to which customer and what was the sales amount.
Below is the expected report Sales / Customer / Month. You will be wondering if we make a simple join query from all three tables we can easily get this output. But imagine if you have huge records in these three tables it can really slow down your reporting process. So we introduced a third dimension table “CustomerSalesByMonth” which will have the foreign keys of all tables and the aggregate amount by month. So this table becomes the dimension table and all other tables become fact tables. All major data warehousing designs use FacJ and. Dimension model.
| Customer Name | Sales Person Name | Month | Sales Amount per Month |
| Man Brothers | Rajesh | Jan | 1000 |
| Suman Motela | Shiv | Jan | 2000 |
| KL enterprises | Rajesh | Feb | 500 |
| KL enterprises | Shiv | Jan | 1000 |
The above design is also called Star Schema design.
Note  For a pure data warehousing job this question is important. So try to understand why we modeled
         out design in this ivay rather than using the traditional approach - normalization.
Question 4.
(DB)What is Snow Flake Schema design in the database?
Answer:
Twist: – What’s the difference between Star and Snowflake schema?
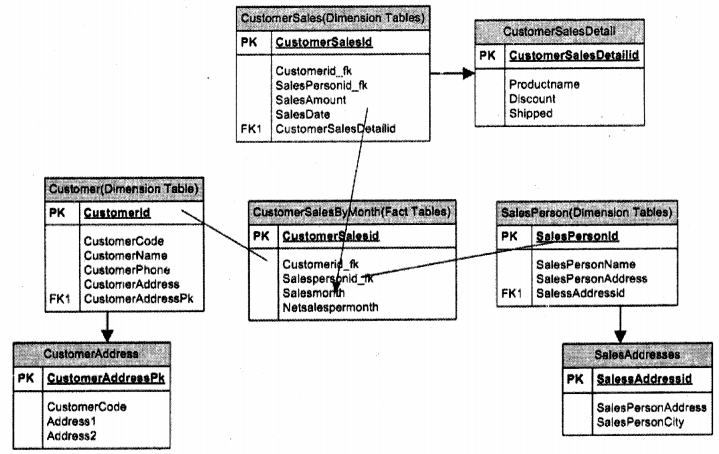
Star schema is good when you do not have big tables in data warehousing. But when tables start becoming really huge it is better to normalize. When you normalize star schema it is nothing but snowflake design. For instance, the below “customer address” table is been normalized and is a child table of the “Customer” table. The same holds true for the “Salesperson” table.
Question 5.
(DB)What is ETL process in Data warehousing?
Answer:
Twist: – What are the different stages in “Data warehousing “?
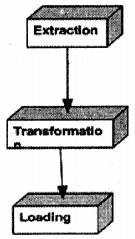
ETL (Extraction Transformation and Loading) are different stages in Data warehousing. Like when we do software development we follow different stages like requirement gathering, designing, coding, and testing. In a similar fashion, we have data warehousing.
Extraction
In this process, we extract data from the source. In actual scenarios, the data sources can be in many forms EXCEL, ACCESS, Delimited text, CSV (Comma Separated Files), etc. So extraction process handle’s the complexity of understanding the data source and loading it in a structure of data warehouse.
Transformation
This process can also be called as cleaning up process. It’s not necessary that after the extraction process data is clean and valid. For instance, all the financial figures have NULL values but you want it to be ZERO for better analysis. So you can have some kind of stored procedure that runs through all extracted records and sets the value to zero.
Loading
After transformation, you are ready to load the information into your final data warehouse database.
Question 6.
(DB)How can we do ETL process in SQL Server?
Answer:
I can hear that scream: – Words and words, show us where does this ETL practically fit in SQL Server.
SQL Server has the following ways with which we can import or export data in SQL Server:-
- BCP (Bulk Copy Program).
- Bulk Insert
- DTS (Data Transformation Services).DTS is now called Integration Services.
Question 7.
What is “Data mining”?
Answer:
“Data mining” is a concept by which we can analyze the current data from different perspectives and summarize the information in a more useful manner. It’s mostly used either to derive some valuable information from the existing data or to predict sales to increase customer market.
There are two basic aims of “Data mining”:-
1. Prediction: – From the given data we can focus on how the customer or market will perform. For instance, we are having a sale of 40000 $ per month in India, if the same product is to be sold with a discount how much sales can the company expect.
2. Summarization: – To derive important information to analyze the current business scenario. For example, a weekly sales report will give a picture to the top management of how we are performing on a weekly basis?
Question 8.
Compare “Data mining” and “Data Warehousing”?
Answer:
“Data Warehousing” is a technical process where we are making our data centralized while “Data mining” is more of a business activity that will analyze how good your business is doing or predict how it will do in the future coming times using the current data.
As said before “Data Warehousing” is not a need for “Data mining”. It’s good if you are doing “Data mining” on a “Data Warehouse” rather than on an actual production database. “Data Warehousing” is essential when we want to consolidate data from different sources, so it’s like cleaner and matured data that sits in between the various data sources and brings them into one format.
“Data Warehouses” are normally physical entities that are meant to improve the accuracy of the “Data mining” process. For example, you have 10 companies sending data in different formats, so you create one physical database for consolidating all the data from different company sources, while “Data mining” can be a physical model or logical model. You can create a database in “Data mining” which gives you reports of net sales for this year for all companies. This need not be a physical database as such but a simple query.
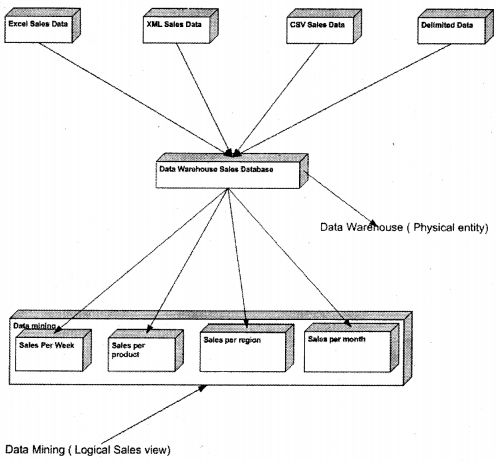
The above figure gives a picture of how these concepts are quite different. “Data Warehouse” collects cleans and filters data through different sources like “Excel”, “XML” etc. But “Data Mining” sits on the top of the “Data Warehouse” database and generates intelligent reports. Now either it can export to a different database or just generate a report using some reporting tool like “Reporting Services”.’
Question 9.
What is BCP?
Answer:
Note  It's not necessary that this question will be asked for data mining. But if an interviewer wants to know your
         DBA capabilities he will love to ask this question. If he is a guy who has worked from the old days of SQL Server
         he will expect this to be answered.
There are times when you want to move huge records in and out of SQL Server, there’s where this old and cryptic friend will come to use. It’s a command-line utility. Below is the detailed syntax:-
bcp {[[<database name>.][<owner>].]{<table name>/<view name>}/ "<query>"}
{in I out I queryout / format} <data file>
[-m <maximum no. of errors>] [-f <format file>] [-e <error file>]
[-F <first row>] [-L <last row>] [-b <batch size>]
[~n] [-c] [-w] [-N] [-V (60 I 65 / 70)] [-6]
[-q] [-C <code page>] [-t <field term>] [-r <row term>]
[-i <input file>] [-o <output file>] [-a <packet size>]
[-S <server name>[\<instance name>]] [-U <login id>] [-P <password>]
[-T] [-v] [-R] [-k] [-E] [-h "<hint> [,...n]"]
UUUHH Lot of attributes there. But during the interview, you do not have to remember so much. Just remember that BCP is a utility with which you can do import and export data.
Question 10.
How can we import and export using BCP utility?
Answer:
In the first question, you can see there is a huge list of different commands. We will try to cover only the basic commands which are used.
-T: – signifies that we are using windows authentification
-t: – By default every record is tab-separated. But if you want to specify comma-separated you can use this command.
-r This specifies how every row is separated. For instance, specifying -r/n specifies that every record will be separated by ENTER.
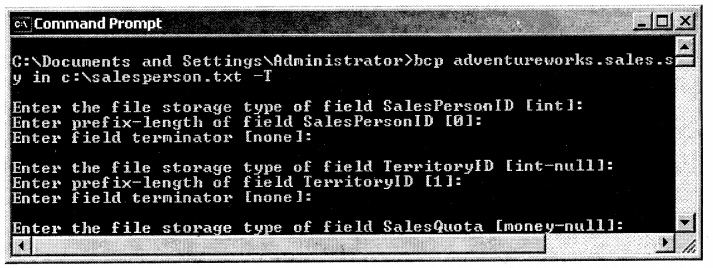
bcp AdventureWorks. sales.salesperson out c:\salesperson.txt -T
bcp AdventureWorks.sales.salespersondummy in c:\salesperson.txt -T
When you execute the BCP syntax you will be prompted to enter the following values (data type, length of the field, and the separator) as shown in the figure below. You can either fill it or just press enter to escape it. BCP will take in the default values.
Question 11.
During BCP we need to change the field position or eliminate some fields how can we achieve this?
Answer:
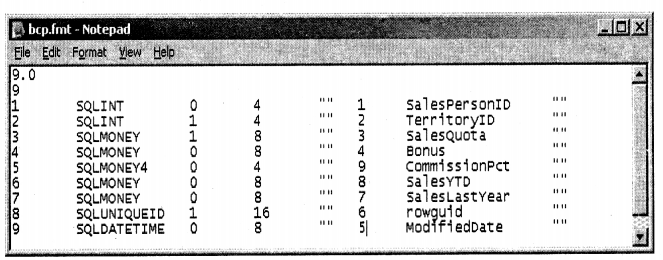
For some reason during BCP you want some fields to be eliminated or you want the positions to be in a different manner. For instance, you have fields, field2, and field3. You want that field2 should not be imported during BCP. Or you want the sequence to be changed as field2, fields, and then finally field3. This is achieved by using the format file. When we ran the BCP command in the first question it has generated a file with the “.fmt” extension. Below is the FMT file generated in the same directory from where I ran my BCP command.
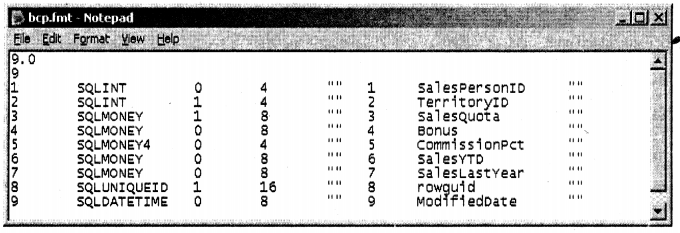
FMT file is basically the format file for BCP to govern how it should map with tables. Let’s say, in from our salesperson table we want to eliminate commission put, sales, and sales last year. So you have to modify the FMT file as shown below. We have made the values zero for the fields which have to be eliminated.
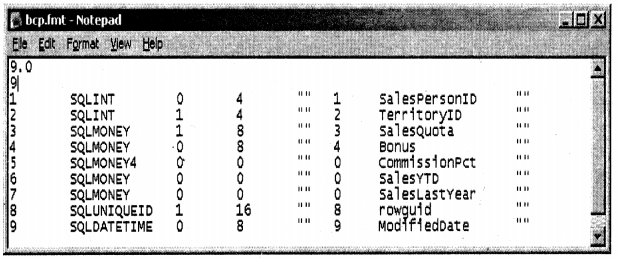
If we want to change the sequence you have to just change the original sequence number. For instance, we have changed the sequence from 9 to 5 –> 5 to 9, see the figure below.
Once you have changed the FMT file you can specify the.FMT file in the BCP command arguments as shown below.
bcp adventureworks.sales.salesperson in c:\salesperson.txt –
c:\bcp.fmt -T
Note we have given the .FMT file in the BCP command.
Question 12.
What is Bulk Insert?
Answer:
Bulk insert is very similar to the BCP command but we can not do export with the command. The major difference between BCP and Bulk Insert:-
- Bulk Insert runs in the same process like SQL Server, so it can avail to all performance benefits of SQL Server.
- You can define Bulk insert as part of a transaction. That means you can use the Bulk Insert command in BEGIN TRANS and COMMIT TRANS statements.
Below is a detailed syntax of BULK INSERT. You can run this from “SQL Server Management Studio”, TSQL or ISQL.
BULK INSERT [['database_name'. ] ['owner'].]
             {'tab1e^name' / 'view_name' FROM 'data_file' }
     [WITH (
             [BATCHSIZE [ = batchesize ]]
             [[,] CHECK_,CONSTRAINTS ]
             [[,] CODEPAGE [ = 'ACP/ 'OEM' / 'RAW / 'code_page' ]]
             [[,] DATAFILETYPE [ = {'char'/'native'/
                                    'widechar'/'widenative' }]]
             [[,] FIELDTERMINATOR [ = 'field_terminator' ]]
             [[,] FIRSTROW [ = first^row ]]
             [[,) FIRETRIGGERS [ = fire_triggers ]]
             [[,] FORMATFILE [ = ’format_file_path' ]]
             [[,] KEEPIDENTITY ]
             [[,] KEEPNULLS ]
             [[,] KILOBYTES_PER_BATCH [ = kilobytes_per_batch ]]
             [[,] LASTROW [ = last_row ]]
             [[, ] MAXERRORS [ = max_errors ]]
             [[,] ORDER ( { column [ ASC / DESC ]}[ , ...n ])]
             [[,] ROWS_PER_BATCH [ = rows_per_batch ]]
             [[,] ROWTERMINATOR [ = 'row_terminator' ]]
             [[,] TABLOCK ]
             )]
Below is a simplified version of the bulk insert which we have used to import a comma-separated file into “SalesPersonDummy”. The first row is the column name so we specified start importing from the second row. The other two attributes define how the fields and rows are separated.
bulk insert adventureworks.sa 1es.sa 1espersondummy from
'c:\salesperson.txt 1 with
(
FIRSTROW=2,
FIELDTERMINATOR = ’,
ROWTERMINATOR = '\n'
)
Question 13.
What is DTS?
Answer:
Note It’s now a part of the integration service in SQL Server 2005.
DTS provides similar functionality as we had with BCP and Bulk Import. There are two
major problems with BCP and Bulk Import:-
1. BCP and Bulk import does not have a user-friendly User Interface. Well some DBA does still enjoy using those DOS prompt commands which makes them feel like doing something worthy.
2. Using BCP and Bulk imports we can import only from files, what if we wanted to import from another database like FoxPro, access, and oracle. That is where DTS is the king.
3. One of the important things that BCP and Bulk insert miss is transformation, which is one of the important parts of the ETL process. BCP and Bulk insert allow you to extract and load data but do not provide any means by which you can do transformation. So for example you are getting sex as “1” and “2”, you would like to transform this data to “M” and “F” respectively when loading into the data warehouse.
4. It also allows you to do direct programming and write scripts by which you can have huge control over the loading and transformation process.
5. It allows a lot of parallel operations to happen. For instance, while you are reading data you also want the transformation to happen in parallel, then DTS is the right choice.
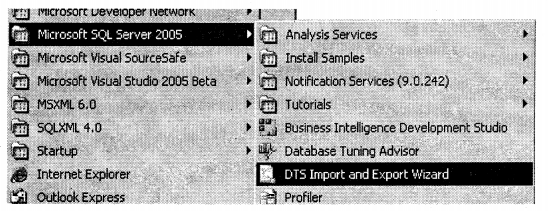
You can see DTS Import / Export wizard in the SQL Server 2005 menu.
Note  DTS is the most used technology when you are during Data warehousing using SQL Server.
          In order to implement the ETL fundamental properly, Microsoft has rewritten the whole DTS from scratch using.
         and named it "Integration Services ". There is a complete chapter which is dedicated to "Integration Services "
         which will cover DTS indirectly in huge detail. Any interviewer who is looking for a data warehousing professional
         in SQL Server2005 will expect that candidates should know DTS properly.
Question 14.
(DB)Can you brief me about the Data warehouse project you worked on?
Answer:
Note   This question is the trickiest and shoot to have insight, from where the interviewer woidd like to
           spazun question threads. If you have worked with a data zoarehouse project you can be very sure of this.
           If not then you really have to prepare a project to talk about.... I know it's unethical to even talk in books but?
I leave this to readers as everyone would like to think of a project of his own. But just try to include the ETL process which every interviewer thinks should be followed for a data warehouse project.
Question 15.
What is an OLTP (Online Transaction Processing) System?
Answer:
Following are the characteristics of an OLTP system:-
- They describe the actual current data of the system
- Transactions are short. For example, the user fills in data and closes the transaction.
- Insert/Update/Delete operation is completely online.
- System design expected to be in the maximum Normalized form.
- Fuge volume of transactions. For example, lots of online users are entering data into an online tax application.
- Backup of the transaction is necessary and needs to be recovered in case of problems
Note OLTP systems are good at putting data into database system but serve no good when it comes to analyzing data.
Question 16.
What is an OLAP (Online Analytical Processing) system?
Answer:
Following are characteristics of an OLAP system:-
- It has historical as well as current data.
- Transactions are long. They are normally batch transaction which is executed during night hours.
- As OLAP systems are mainly used for reporting or batch processing, so “Denormalization” designs are encouraged.
- Transactions are mainly batch transactions which are running so there are no huge volumes of transaction.
- Does not need to have a recovery process as such until the project specifies specifically.
Question 17.
What is the Conceptual, Logical, and Physical model?
Answer:
Depending on the client’s requirement first, you define the conceptual model followed by the logical and physical model.
The conceptual model involves only identifying entities and relationships between. Fields / Attributes are not planned at this stage. It’s just an identifying stage but not in detail.
The logical model involves actually identifying the attributes, primary keys, many-to-many relationships, etc of the entity. In short, it’s the complete detailed planning of what actually has to be implemented.
A physical model is where you develop your actual structure tables, fields, primary keys, foreign leys, etc. You can say it’s the actual implementation of the project.
Note  To Design conceptual and logical model mostly VISIO is used and some company combines this both
          model in one time. So you will not be able to distinguish between both models.
Question 18.
(DB)What is Data purging?
Answer:
You can also call this data cleaning. After you have designed your data warehouse and started importing data, there is always a possibility you can get in a lot of junk data. For example, you have some rows which have NULL and spaces, so you can run a routine that can delete these kinds of records. So this cleaning process is called “Data Purging”.
Question 19.
What are Analysis Services?
Answer:
Analysis Services (previously known as OLAP Services) was designed to draw reports from data contained in a “Data Warehouses”.” Data Warehouses” do not have typical relational data structure (fully normalized way), but rather have snowflake or star schema (refer star schema in the previous sections).
The data in a data warehouse is processed using online analytical processing (OLAP) technology. Unlike relational technology, which derives results by reading and joining data when the query is issued, OLAP is optimized to navigate the summary data to quickly return results. As we are not going through any joins (because data is in denormalized form) SQL queries are executed faster and in more optimized way.
Question 20.
(DB)What arc CUBES?
Answer:
As said in the previous question analysis services do not work on relation tables, but rather use “CUBES”. Cubes have two important attributes dimensions and measures. Dimensions are data like Customer type, country name, and product type. While measures are quantitative data like dollars, meters, and weight. Aggregates derived from original data are stored in cubes.
Question 21.
(DB)What are the primary ways to store data in OLAP?
Answer:
There are primary three ways in which we store information in OLAP:-
MOLAP
Multidimensional OLAP (MOLAP) stores dimension and fact data in a persistent data store using compressed indexes. Aggregates are stored to facilitate fast data access. MOLAP query engines are usually proprietary and optimized for the storage format used by the MOLAP data store. MOLAP offers faster query processing than ROLAP and usually requires less storage. However, it doesn’t scale as well and requires a separate database for storage.
ROLAP
Relational OLAP (ROLAP) stores aggregate in relational database tables. ROLAP use of relational databases allows it to take advantage of existing database resources, plus it allows ROLAP applications to scale well. However, ROLAP’s use of tables to store aggregates usually requires more disk storage than MOLAP, and it is generally not as fast.
HOLAP
As its name suggests, hybrid OLAP (HOLAP) is a cross between MOLAP and ROLAP. Like ROLAP, HOLAP leaves the primary data stored in the source database. Like MOLAP, HOLAP stores aggregates in a persistent data store that’s separate from the primary relational database. This mix allows HOLAP to offer the advantages of both MOLAP and ROLAP. However, unlike MOLAP and ROLAP, which follow well-defined standards, HOLAP has no uniform implementation.
Question 22.
(DB)What is METADATA information in Data warehousing projects?
Answer:
METADATA is data about data. Well, that’s not enough definition for interviews we need something more than that to tell the interviewer. It’s the complete documentation of a data warehouse project. From the perspective of SQL Server, all Metadata is stored in a Microsoft repository. It’s all about the way the structure is of data warehouse, OLAP, DTS packages.
Just to summarize some elements of data warehouse Metadata are as follows:-
- Source specifications — such as repositories, source schemas, etc.
- Source descriptive information — such as ownership descriptions, updates frequencies, legal limitations, access methods, etc.
- Process information — such as job schedules, extraction code.
- Data acquisition information — such as data transmission scheduling, results, and file usage.
- Dimension table management — such as definitions of dimensions, surrogate key.
- Transformation and aggregation — such as data enhancement and mapping, DBMS load scripts, aggregate definitions &c.
- DMBS system table contents,
- descriptions for columns
- network security data
All Metadata is stored in system tables MSDB. META data can be accessed using repository API, DSO (Decision Support Objects).
Question 23.
(DB)What is multi-dimensional analysis?
Answer:
Multi-dimensional is looking at data from different dimensions. For example, we can look at a simple sale of a product month-wise.

But let’s add one more dimension “Location” wise.
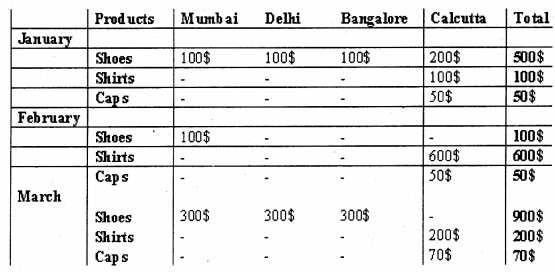
The above table gives a three-dimension view; you can have more dimensions according to your depth of analysis. Like from the above multi-dimension view I am able to predict that
“Calcutta” is the only place where “Shirts” and “Caps” are selling, *^ier metros^do not show any sales for this product. ‘ > ^
Question 24.
(DB)What is MDX?
Answer:
MDX stands for multi-dimensional expressions. When it comes to viewing data from multiple dimensions SQL lacks many functionalities, there’s where MDX queries are useful. MDX queries are fired against OLAP databases. SQL is good for transactional databases (OLTP databases), but when if comes to analysis queries MDX stands at the top.
Note If you are planningfor a data warehousing position using SQL Server2005, MDX will be the favorite of the interviewers. MDX itself is such a hugeand beautiful beast ihat we cannot cover in this small book. I will suggest at least try to grab some basic syntaxes of MDX like select before going to interview.
Question 25.
(DB)How did you plan your Data warehouse project?
Answer:
Note  This question will come up if the interviewer wants to test that had you really worked on any data
          warehouse project. Second if he is lookingfor a project manager or team lead position.
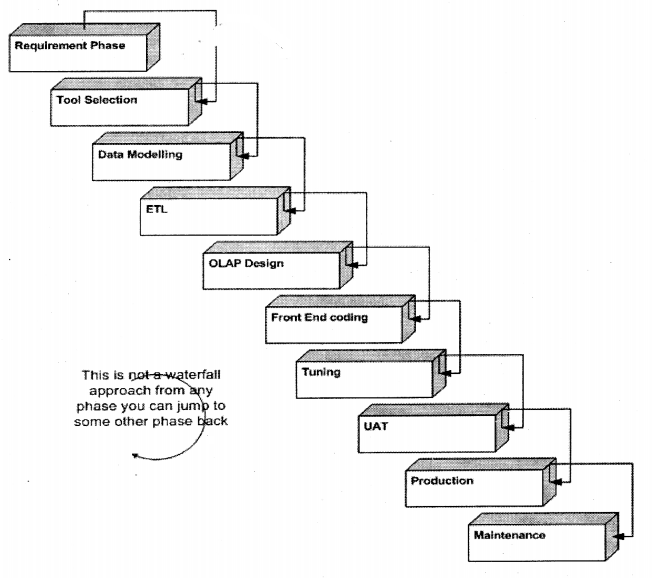
Below are the different stages in the Data warehousing project:-
- System Requirement Gathering ‘
This is what every traditional project follows and data warehousing is no different. What exactly is this complete project about? What is the client expecting? Do they have an existing database that they want to a data warehouse or do we have to collect from a lot of places? If we have to extract from a lot of different sources, what are they and how many are they?. For instance, you can have a customer who will say this is the database now data warehouse it. Or customers can say consolidate data from EXCEL, ORACLE, SQL Server, CSV files, etc. So if more disparate systems more are the complications. Requirement gathering clears all these things and gives a good road map for the project ahead.
Note  Many data warehouse projects take requirement gatheringfor granted. But lam sure when customer
          will come up during execution with, I want that (Sales by month) and also that (consolidate data from
          those 20 excels) and that (prepare those extra two reports) and that (migrate that database).... and the project
          goes there (programmer work over time) and then there (projectgoes over budget) and then l'Client looses
         interest).... Somewhere (software company goes under loss).
- Selecting Tool.
Once you are ok with the requirement it’s time to select which tools can do good work for you. This book only focuses on SQL Server 2005, but in reality, there are many tools for data warehousing. Probably SQL Server 2005 will sometimes not fit your project requirement and you would like to opt for something else.
- Data Modeling and design
This where the actual designing takes place. You do conceptual and logical designing of your database, star schema design.
- ETL Process y
This forms the major part of any data warehouse project. Refer the previous section to see what an ETL process is. ETL is the execution phase for a data warehouse project. This is the place where you will define your mappings, create DTS packages, define workflow, writing scripts, etc. A major issue when we do the ETL process is about performance which should be considered while executing this process.
Note Refer "Integration Services" for how to do the ETL process using SQL Server 2005.
- OLAP Cube Design
This is the place where you define your CUBES, DIMENSIONS on the data warehouse database which was loaded by the ETL process. CUBES and DIMENSIONS are done by using the requirement specification. For example, you see that customer wants a report “Sales Per month” so he can define the CUBES and DIMENSIONS which later will be absorbed by the front end for viewing it to the end-user.
- Front End Development
Once all your CUBES and DIMENSIONS are defined you need to present them to the user. You can build your front ends for the end-user using C#, ASP.NET, VB.NET any language which has the ability to consume the CUBES and DIMENSIONS. The front end stands on top of CUBES and DIMENSION and delivers the report to the end-users. Without any front end, the data warehouse will be of no use from the user’s perspective.
- Performance Tuning
Many projects tend to overlook this process. But just imagine a poor user sitting to view “Yearly Sales” for 10 minutes… .frustrating no. There are three sections where you can really look at why your data warehouse is performing slow:-
1. While data is loading in the database “ETL” process.
This is probably the major area where you can optimize your database. The best is to look into DTS packages and see if you can make it better to optimize speed.
2. OLAP CUBES and DIMENSIONS.
CUBES and DIMENSIONS are something that will be executed against the data warehouse. You can look into the queries and see if some optimization can be done.
3. Front-end code.
The front end is mostly coded by programmers and this can be a major bottleneck for optimization. So you can probably look for loops and you also see if the front end is running too far away from the CUBES.
User Acceptance Test ( UAT)
UAT means saying to the customer “Is this product ok with you?”. It’s a testing phase that can be done either by the customer (and mostly done by the customer) i>r by your own internal testing department to ensure that its matches with the customer requirement which was gathered during the requirement phase.
1. Rolling out to Production
Once the customer has approved your UAT, it’s time to roll out the data warehouse in production so that customer can get the benefit of it.
2. Production Maintenance
I know the most boring aspect from a programmer’s point of view, but the most profitable from an IT company’s point of view. In data warehousing, this will mainly involve doing backups, optimizing the system, and removing any bugs. This can also include any enhancements if the customer wants them.
Question 26.
What are different deliverables according to phases?
Answer:
Note Deliverables mean the documents you will submit during each phase. For instance, Source code is deliverable for the execution phase, Use Case Documents or UML documents are a deliverable for the requirement phase. In short, what will you give to the client during each phase?.
Following are the deliverables according to phases:-
- Requirement phase: – System Requirement documents, Project management plan, Resource allocation plan, Quality management document, Test plans, and Number of reports the customer is looking at. I know many people from IT will start raising their eyeballs they do not mix project management with requirement gathering. But that’s a debatable issue I leave it to you guys if you want to further split it.
- Tool Selection: – POC (proof of concept) documents comparing each tool according to project requirement.
Note  POC means can we do?. For instance you have a requirement that, 2000 users at a time should
          be able to use your data warehouse. So you will probably zvrite some sample code or read through
          documents to ensure that it does it.
1. Data modeling: – Logical and Physical data model diagram. This can be ER diagrams or probably some format which the client understands.
2. ETL: – DTS packages, Scripts, and Metadata.
3. OLAP Design:-Documents which show the design of CUBES / DIMENSIONS and OLAP
CUBE report.
4. Front-end coding: – Actual source code, Source code documentation, and deployment documentation.
5. Tuning: – This will be a performance tuning document. What performance level we are looking at and how will we achieve it or what steps will be taken to do so. It can also include what areas/reports are we targeting performance improvements.
6. UAT: – This is normally the test plan and test case document. It can be a document that has steps on how to create the test cases and expected results.
7. Production: – In this phase normally the entire data warehouse project is the deliverable. But you can also have handover documents of the project, hardware, network settings, in short, how is the environment setup.
8. Maintenance: – This is an ongoing process and mainly has documents like error fixed, issues solved, within what time the issues should be solved, and within what time it was solved.
Question 27.
(DB)Can you explain how the analysis service works?
Answer:
Note Ok guys this question is small but the answer is going to be massive. You are going to just summarize them but lam going to explain analysis services in detail, step by step with a small project. For this complete explanation, I am taking the old sample database of Microsoft “North Wind”.
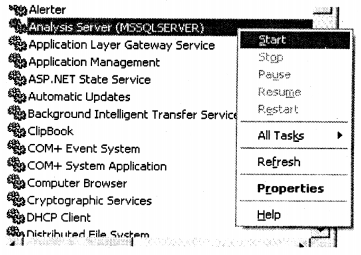
First and foremost ensure that your service is started so go to the control panel, services and start the “Analysis Server “service.
As said before we are going to use the “NorthWind” database for showing the analysis server demo.
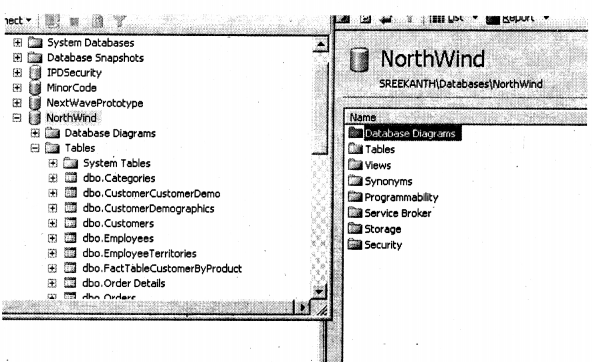
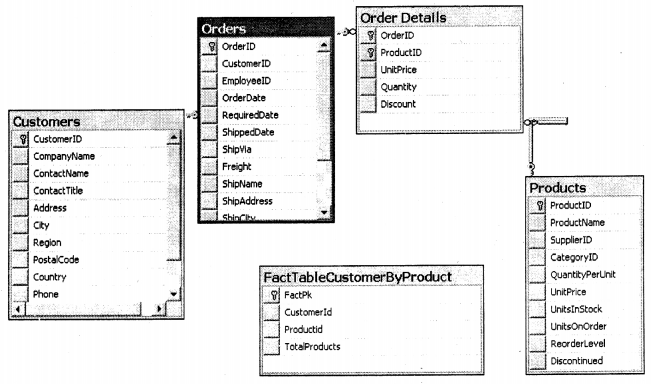
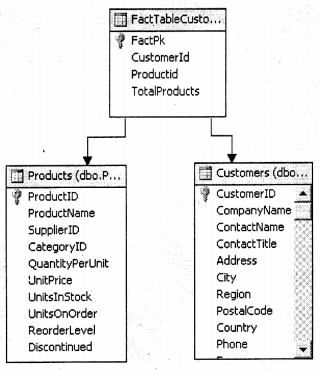
We are not going to use all tables from “NorthWind”. Below are the only tables we will be operating using. Leaving the”FactTableCustomerByProduct” all other tables are self-explanatory. Ok I know I have still not told you what we want to derive from this whole exercise. We will try to derive a report on how many products are bought by which customer and how many products are sold according to which country. So I have created the fact table with three fields Customer id, Productid, and the TotalProducts sold. All the data in the Fact table I have loaded from “Orders” and “Order Details”. This means I have taken all customers and productid with their respective totals and made entries in the fact table.
Ok, I have created my fact table and also populated using our ETL process. Now it’s time to use this fact table to do analysis.
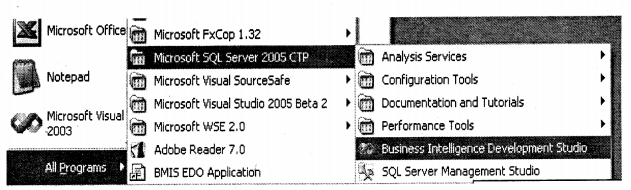
So, let’s start our BI studio as shown in the figure below.
Select “Analysis” project from the project types.
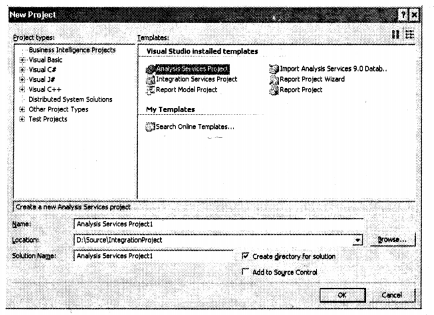
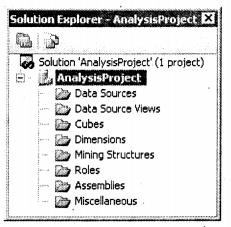
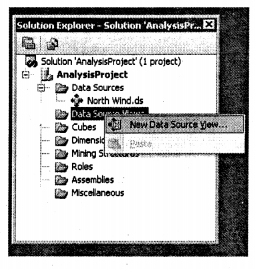
I have named the project ” AnalysisProject”. You can see the view of the solution explorer.
Data Sources:- This is where we will define our database and connection.
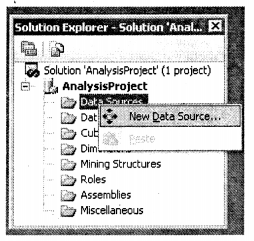
To add a new “data Source” right-click and select “new Data Source”.
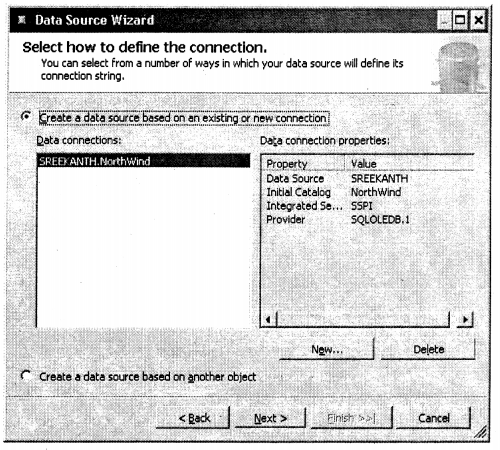
After that click next and you have to define the connection for the data source which you can do by clicking on the new button. Click next to complete the data source process.
After that, it’s time to define a view.
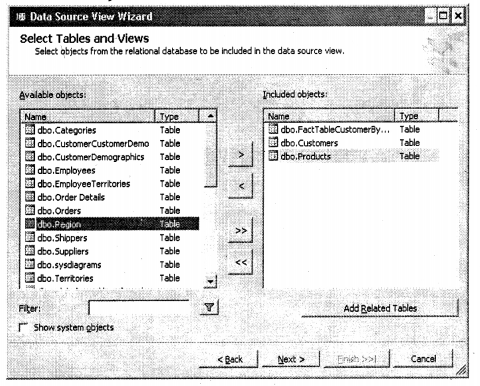
Data Source View:- It’s an abstraction view of the data source. The data source is the complete database. it’s rare that we will need the complete database at any moment of time. So in “data source View” We can define which tables we want to operate on. Analysis server never operates on data source directly but it only speaks with the “Data Source” view.
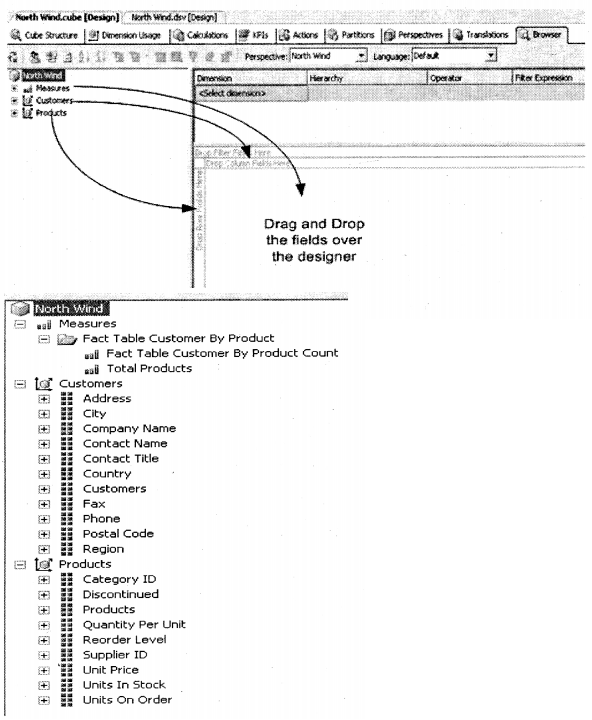
So here we will select only two tables “Customers”, “Products” and the fact table.
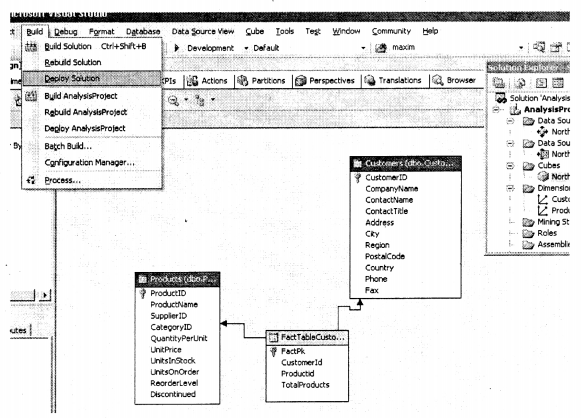
We had said previously fact table is a central table for dimension table. You can see products and customers tables from the dimension table and the fact table is the central point. Now drag and drop from the “Customer” of fact table to the “Customer” field of the customer table. Repeat the same for the “productid” table with the products table.
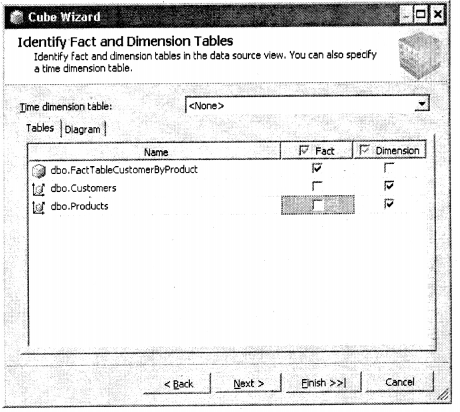
Check “Autobuild” as we are going to let the analysis service decide which tables he wants to decide as “fact” and “Dimension” tables.
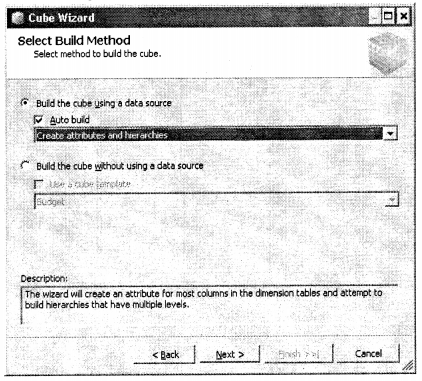
After that comes the most important step which are the fact tables and which are dimension tables. SQL Analysis services decide by themselves, but we will change the values as shown in the figure below.
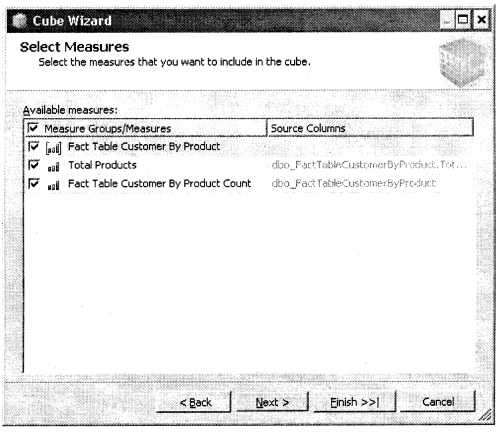
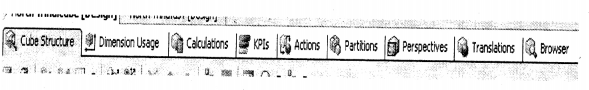
This screen defines measures.
- Cube Builder Works with the cube measures
- Dimensions Work with the cube dimensions
- Calculations Work with calculations for the cube
- KPIs Works with Key Performance Indicators for the cube
- Actions Work with cube actions
- Partitions Work with cube partitions
- Perspectives Work with views of the cube
- Translations Define optional transitions for the cube
- Browser Enables you to browse the deployed cube
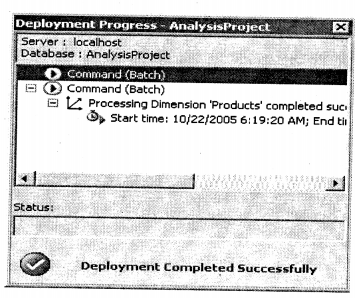
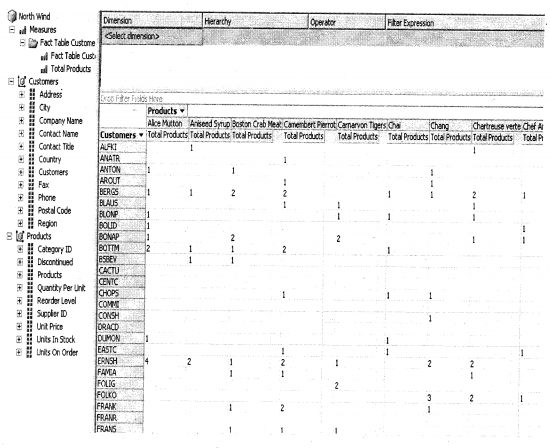
Once you have dragged dropped the fields you can see the wonderful information unzipped between which customer has bought how many products.
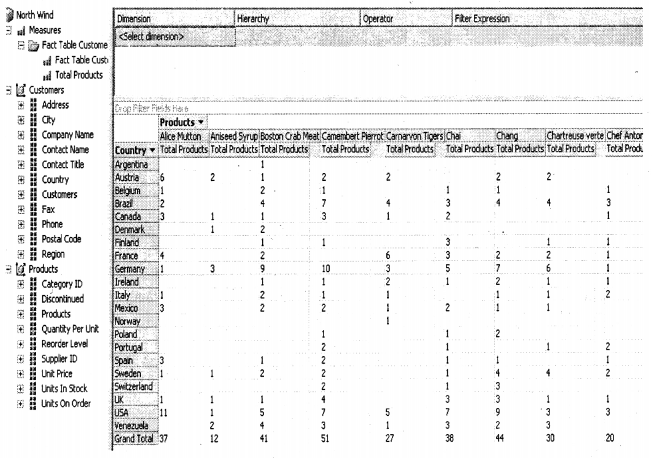
This is the second report which says in which country I have sold how many products.
This is the second report which says in which country I have sold how many products.
Note  I do not want my book to increase pages just because of images but sometimes the nature
         of the explanation demands it. Now you can just summarize to the interviewer from the above
          steps how you work with analysis services.
Question 28.
What are the different problems that “Data mining” can solve?
Answer:
There are basically four problems that “Data mining” can solve:-
Analyzing Relationships
This term is also often called “Link Analysis”. For instance one of the companies who sold adult products did an age survey of his customers. He found his entire products were bought by customers between .age of 25 – 29. He further became suspicious that all of his customers must have kids around 2 to 5 years as that’s the normal age of marriage. He analyzed further and found that a maximum of his customers was married with kids. Now the company can also try selling kid products to the same customer as they will be interested in buying it, which can tremendously boost up his sales. Now here the link analysis was done between the “age” and “kids” to decide on a marketing strategy.
Choosing right Alternatives
If a business wants to make a decision between choices data mining can come to the rescue. For example, one of the companies saw a major resignation wave in his company. So the HR decided to have a look at employee’s joining date. They found that major of the resignations have come from employee’s who have stayed in the company for more than 2 years and
there were some resignations from fresher. So the HR made the decision to motivate the freshers rather than 2 years completed employee’s to retain people. As HR thought it’s easy to motivate freshers rather than old employees.
Prediction
Prediction is more about forecasting how the business will move ahead. For instance, company has sold 1000 Shoe product items, if the company puts a discount on the product sales can go up to 2000.
Improving the current process.
Past data can be analyzed to view how we can improve the business process. For instance, for the past two years company has been distributing product “X” using plastic bags and product “Y” using paper bags. The company has observed closely that product “Y” sold the same amount as product “X” but has huge profits. The company further analyzed that the major cost of product “X” was due to packaging the product in plastic bags. Now the company can improve the process by using paper bags and bringing down the cost and thus increasing profits.
Question 29.
What are the different stages of “Data mining”?
Answer:
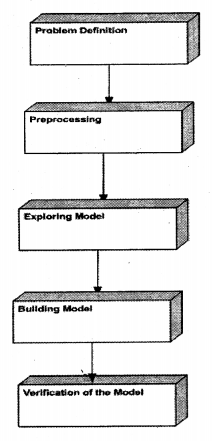
Problem Definition.
This is the first step in “Data mining” define the metrics by which the model will be evaluated. For instance, if it’s a small travel company he would like to measure his model on the number of tickets sold, but if it’s a huge travel company with a lot of agents he would like to see it with the number of tickets / Agents sold. If it’s a different industry together like a bank they would like to see the actual amount of transactions done per day.
There can be several models which a company wants to look into. For instance, in our previous travel company model, they would like to have the following metrics:-
- Ticket sold per day
- Number of Tickets sold per agent
- Number of tickets sold per airline
- Number of refunds per month
So you should have the following checklist:-
- What attribute do you want to measure and predict?
- What type of relationship do you want to explore? In our travel company example, you would like to explore the relationship between the number of tickets sold and the Holiday patterns of a country.
Preprocessing and Transforming Data
This can also be called as loading and cleaning of data or removing unnecessary information to simplify data. For example, you will be getting data for the title as “Mr.”, “M.r.”, “Miss”, “Ms” etc … Hmm can go worst if these data are maintained in the numeric format “1”, “2”, “6” etc…This data needs to be cleaned for better results.
You also need to consolidate data from various sources like EXCEL, Delimited Text files; any other databases (ORACLE, etc).
Microsoft SQL Server 2005 Integration Services (SSIS) contains tools that can be used for cleaning and consolidating from various services.
Note Data warehousing ETL process is a subset of this section.
Exploring Models
Data mining / Explore models mean calculating the min and max values, look into any serious deviations that are happening, and how is the data distributed. Once you see the data you can look into if the data is flawed or not. For instance, normal hours in a day are 24 and you see some data has more than 24 hours which is not logical. You can then look into correcting the same.
Data Source View Designer in BI Development Studio contains tools that can let you analyze data.
Building Models
Data derived from Exploring models will help us to define and create a mining model. A model typically contains input columns, an identifying column, and a predictable column. You can then define these columns in a new model by using the Data Mining Extensions (DMX) language or the Data Mining Wizard in BI Development Studio.
After you define the structure of the mining model, you process it, populating the empty structure with the patterns that describe the model. This is known as training the model. Patterns are found bypassing the original data through a mathematical algorithm. SQL Server 2005 contains a different algorithm for each type of model that you can build. You can use parameters to adjust each algorithm.
A mining model is defined by a data mining structure object, a data mining model object, and a data mining algorithm.
Verification of the models.
By using viewers in Data Mining Designer in BI Development Studio you can test/verify how well these models are performing. If you find you need any refining in the model you have to again iterate to the first step.
Question 30.
(DB)What is Discrete and Continuous data in the Data mining world?
Answer:
Discrete: – A data item that has a finite set of values. For example Male or Female.
Continuous: – This does not have a finite set of values, but rather a continuous value. For instance sales amount per month. .
Question 31.
(DB)What is MODEL in the Data mining world?
Answer:
MODEL is extracting and understanding different patterns from data. Once the patterns and trends of how data behaves are known we can derive a model from the same. Once these models are decided we can see how these models can be helpful for prediction/forecasting, analyzing trends, improving the current processes etc.
Question 32.
(DB)How are models actually derived?
Answer:
Twist: – What are Data Mining Algorithms?
Data mining models are created using Data mining algorithms. So to derive a model you apply a Data mining algorithm on a set of data. The data mining algorithm then looks for specific trends and patterns and derives the model.
Note  Now we will go through some algorithms which are used in the "Data Mining " world.
          If you are looking out for pure "Data Mining" jobs, these basic questions will be surely asked.
          The data mining algorithm is not Microsoft proprietary but is old math's which is been used by
          Microsoft SQL Server. The below section will look like we are moving away from SQL Server
          but trust me... if you are looking out for data mining jobs these questions can be a turning point.
Question 33.
(DB)What is a Decision Tree Algorithm?
Answer:
Note  As we have seen in the first question that to derive a model we need algorithms.
          The further section will cover basic algorithms which will be asked during interviews.
“Decision Tree” is the most common method used in “data mining”. In a decision tree structure leaves determine classification and the branches represent the reason for classifications.
For instance below is a sample data collected for an ISP provider who is in supplying “Home Internet Connection”.
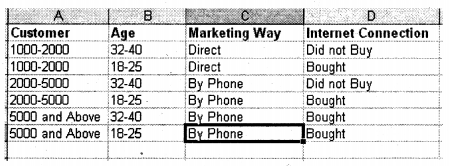
Based on the above data we have made the following decision tree. So you can see decision tree takes data and then start applying attribute comparison on every node recursively.
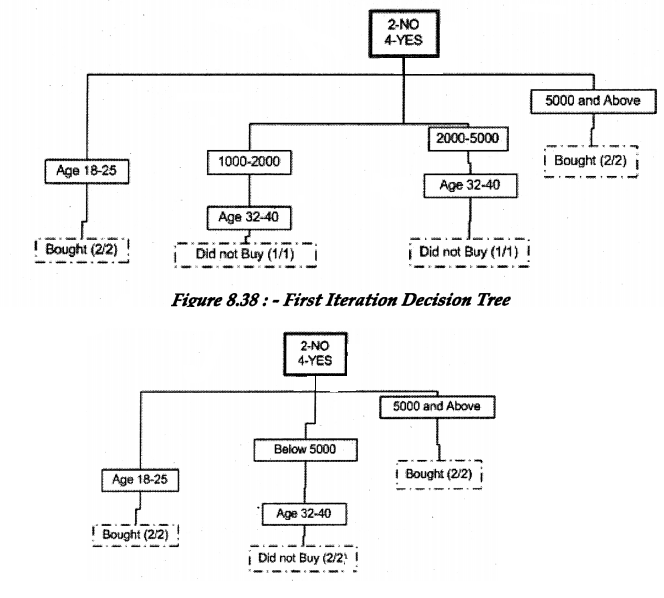
From the “Decision Tree” diagram we have concluded the following predictions”
- Age 18-25 always buys internet connection, irrelevant of income.
- Income drawers above 5000 always buy internet connection, irrelevant of age.
Using this data we have made predictions that if we market using the above criteria’s we can make more “Internet Connection” sales.
So we have achieved two things from the “Decision tree”:-
Prediction
- If we market to age groups between 32-40 and income below 5000 we will not have decent sales.
- If we target customers with Age group 18-25 we will have good sales.
- All income drawers above 5000 will always have sales.
Classification
- Customer classification by Age.
- Customer classification depending on the income amount.
Question 34.
(DB)Can a decision tree be implemented using SQL?
Answer:
With SQL you can only look through one angle point of view. But with a decision tree, as you traverse recursively through all data you can have a multi-dimensional view. For example, give above using SQL you could have made the conclusion that age 18-25 has 100 % sales result. But “If we market to age groups between 32-40 and income below 5000 we will not have decent sales.” Probably a SQL can not do (we have to be too heuristic).
Question 35.
(DB)What is the Naive Bayes Algorithm?
Answer:
“Bayes’ theorem can be used to calculate the probability that a certain event will occur or that a certain proposition is true, given that we already know a related piece of information.”
Ok, that’s a difficult thing to understand let’s make it simple. Let’s take for instance the sample data down.
| A | B | C | D | E |
| Customer | Pants | Shirts | Shoes | Socks |
| Cust 1 | 1 | X | X | X |
| Cust 2 | X | 1 | X | X |
| Cust 3 | X | X | 1 | X |
| Cust 4 | X | X | X | 1 |
| Cust 5 | 1 | 1 | X | X |
| Cust 6 | 1 | 1 | X | X |
| Cust 7 | X | X | 1 | 1 |
| Cust 8 | x | x | 1 | 1 |
If you look at the sample we can say that 80 % of time customer who buys pants also buys shirts.
P (Shirt | Pants) = 0.8
Customer who buys shirts are more than who buys pants, we can say 1 of every 10 customers will only buy shirts and 1 of every 100 customers will buy only pants.
P (Shirts) = 0.1
P (Pants) = 0.01
Now suppose we a customer comes to buys pants how much is the probability he will buy a shirt and vice-versa. According to the theorem:-
Probability of buying shirt if bought pants = 0.8-0.01 / 0.1=7.9
Probability of buying pants if bought shirts = 0.8-0.1 / 0.01=70
So you can see if the customer is buying shirts there is a huge probability that he will buy pants also. So you can see naive bayes algorithm is used for predicting depending on existing data.
Question 36.
(DB)Explain clustering algorithm?
Answer:
“Cluster is a collection of objects which have similarity between then and are dissimilar from objects different clusters.”
Following are the ways a clustering technique works:-
- Exclusive: A member belongs to only one cluster.
- Overlapping: A member can belong to more than one cluster.
- Probabilistic: A member can belong to every cluster with a certain amount of probability.
- Hierarchical: Members are divided into hierarchies, which are sub-divided into clusters at a lower level.
Question 37.
(DB)Explain in detail Neural Networks?
Answer:
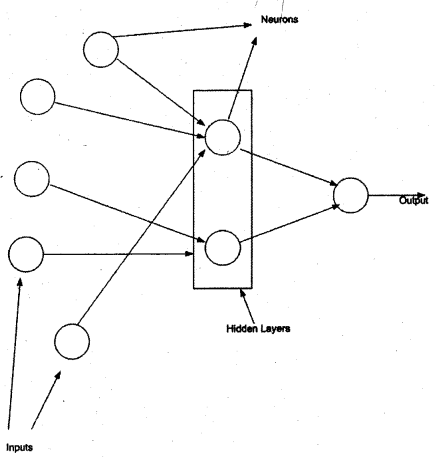
Humans always wanted to beat god and neural networks are one of the steps towards that. The neural network was introduced to mimic the sharpness of how the brain works. Whenever humans see something, any object for instance an animal. Many inputs are sent to his brain, for example, it has four legs, big horns, a long tail, etc. With these inputs, your brain concludes that it’s an animal. From childhood, your brain has been trained to understand these inputs and your brain concludes output depending on that. This all happens because of those 1000 neurons which are working inside your brain, inter-connected to decide the output.
That’s what humans tried to devise neural networks. So now, you must be thinking about how it works.
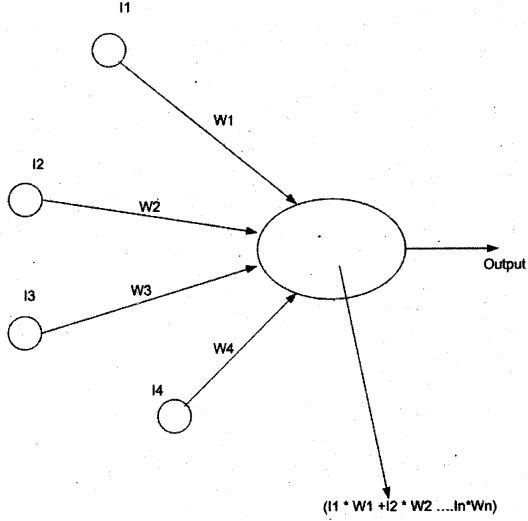
Above is the figure which shows a neuron model. We have inputs (II, 12 … IN) and for every input, there are weights (Wl, W2 …. WN) attached to it. The ellipse is the “NEURON”. Weights can have negative or positive values. Activation value is the summation and multiplication of all weights and inputs coming inside the nucleus.
Activation Value = I1 * W1 + I2 * W2+ I3 * W3+ I4* W4…….IN * WN
There is a threshold value specified in the neuron which evaluates to Boolean or some value if the activation value exceeds the threshold value.
So probably feeding a customer sales records we can come out with output is the sales department under profit or loss.
| Input | Weight | Input*weight | |
| Description | Number of Customer | Sales Amount per customer | Net sales |
| London | 12 | 200 | 2400 |
| India | 10 | 100 | 1000 |
| Germany | 13 | 150 | 1950 |
| Greece | 5 | 40 | 200 |
| Total sales figure | 5650 |
For instance, take the case of the top customer sales data. Below is the neural network defined for the above data.
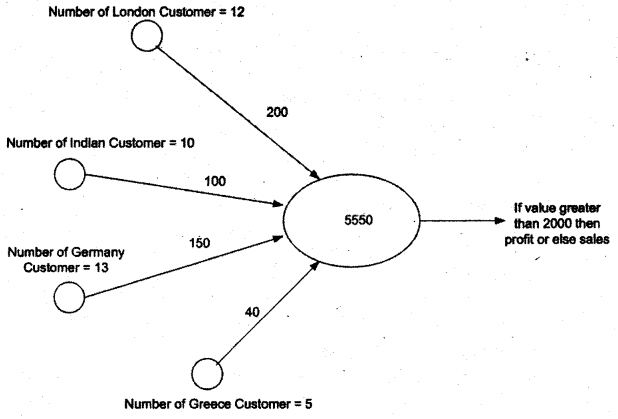
You can see neuron has calculated the total as 5550 and as. it’s greater than threshold 2000 we can say the company is under profit.
The above example was explained from a simplification point of view. But in the actual situation, there can many neurons as shown in the figure below. It’s a complete hidden layer from the data miner’s perspective. He drily looks into inputs and outputs for that scenario.
Question 38.
(DB)What is Backpropagation in Neural Networks?
Answer:
Backpropagation helps you minimize errors and optimize your network. For instance, in our top example, we get neuron summation as 80000000000, which is a weird figure (as you are expecting values between 0 to 6000 maximum). So you can always go back and look at whether you have some wrong input or weights. So the error is again Fed back to the neural network and the weights are adjusted accordingly. This is also called training the model.
Question 39.
(DB)What is the Time Series algorithm in data mining?
Answer:
The Microsoft Time Series algorithm allows you to analyze and forecast any time-based data, such as sales or inventory. So the data should be continuous and you should have some past data on which it can predict values.
Question 40.
(DB)Explain Association algorithm in Data mining?
Answer:
Association algorithm tries to find relationships between specific categories of data. In Association first, it scans for unique values and then the frequency of values in each transaction is determined. For instance, if let us say we have city master and transactional customer sales table. The association algorithm first finds a unique instance of all cities and then sees how many city occurrences have occurred in the customer sales transactional table.
Question 41.
(DB)What is a Sequence clustering algorithm?
Answer:
Sequence clustering algorithm analyzes data that contains discrete-valued series. It looks for how the past data is transitioning and then makes future predictions. It’s a hybrid of clustering and sequencing algorithm
Note  UUUh I understand algorithms are dreaded level questions and will never be asked for programmer
          level job, but for guys looking for Data mining jobs these questions are basic. It's difficult to cover all
          algorithms existing in the data mining world, as its complete area by itself As been an interview question
          book I have covered algorithms which is absolutely essential from SQL Server point of view.
          Now we know the algorithms we can classify where they can be used. There are two important
          classifications in the data mining world Prediction / Forecasting and grouping. So we will classify
          all algorithms which are shipped in SQL server in these two sections only.
Question 42.
(DB)What are the algorithms provided by Microsoft in SQL Server?
Answer:
Predicting an attribute, for instance, how much will be the product sales next year.
- Microsoft Decision Trees Algorithm
- Microsoft Naive Bayes Algorithm
- Microsoft Clustering Algorithm
- Microsoft Neural Network Algorithm.
Predicting a continuous attribute, for example,/to forecast next year’s sales. - Microsoft Decision Trees Algorithm
- Microsoft Time Series Algorithm
Predicting a sequence, for example, to perform a clickstream analysis of a company’s Web site. - Microsoft Sequence Clustering Algorithm
Finding groups of common items in transactions, for example, to use market basket analysis to suggest additional products to a customer for purchase. - Microsoft Association Algorithm
- Microsoft Decision Trees Algorithm
Finding groups of similar items, for example, to segment demographic data into groups to better understand the relationships between attributes. - Microsoft Clustering Algorithm
- Microsoft Sequence Clustering Algorithm
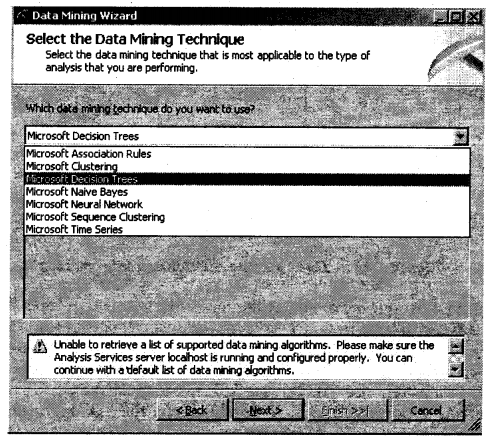
Why we went through all these concepts is when you create a data mining model you have to specify one of the algorithms. Below is the snapshot of all SQL Server existing algorithms.
A Data Mining Wizard
Note During interviewing it’s mostly the theory that counts and the way you present. For datamining lam not showing anything practical as such probably will try to cover this thing in my second edition. But it’s advice please do try to run make a small project and see how these techniques are actually used.
Question 43.
(DB)How do data mining and data warehousing work together?
Answer:
Twist: – What is the difference between data warehousing and data mining?
This question will be normally asked to get an insight into how well you know the whole process of data mining and data warehousing. Many new developers tend to confuse data mining with warehousing (especially freshers). Below is the big picture which shows the relation between “data warehousing” and “data mining”.
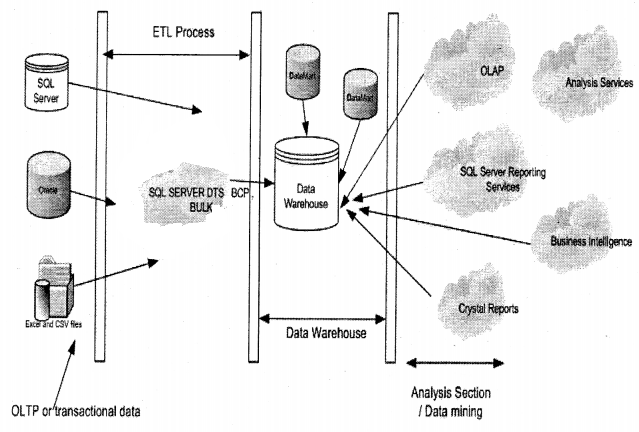
Let’s start from the most left-hand side of the image. The first section comes is the transaction database. This is the database in which you collect data, Next process is the ETL process. This section extracts data from the transactional database and sends it to your data warehouse which is designed using the STAR or SNOWFLAKE model. Finally, when your data warehouse data is loaded in a data warehouse, you can use SQL Server tools like OLAP, Analysis Services, BI, Crystal reports, or reporting services to finally deliver the data to the end-user.
Note  Interviezver will always try to goof you up by saying why should not give run OLAP, Analysis Services,
         BI, Crystal reports, or reporting services directly on the transactional data. That is because the transactional
         database is an incomplete normalized form which can make the data mining process complete slow.
        By doing data warehousing we denormalize the data which makes the data mining process more efficient.
Question 44.
What is XMLA?
Answer:
XML for Analysis (XMLA) is fundamentally based on web services and SOAP. Microsoft SQL Server 2005 Analysis Services uses XMLA to handle all client application communications to Analysis Services.
XML for Analysis (XMLA) is a Simple Object Access Protocol (SOAP)-based XML protocol, designed specifically for universal data access to any standard multidimensional data source residing on the Web. XMLA also eliminates the need to deploy a client component that exposes Component Object Model (COM) or Microsoft .NET Framework.
Question 45.
What is Discover and Execute in XMLA?
Answer:
The XML for Analysis open standard describes two generally accessible methods: Discover and Execute. These methods use the loosely coupled client and server architecture supported by XML to handle incoming and outgoing information on an instance of SSAS.
The Discover method obtains information and metadata from a Web service. This information can include a list of available data sources, as well as information about any of the data source providers. Properties define and shape the data that is obtained from a data source. The Discover method is a common method for defining the many types of information a client application may require from data sources on Analysis Services instances. The properties and the generic interface provide extensibility without requiring you to rewrite existing functions in a client application.
The Execute method allows applications to run provider-specific commands against XML for Analysis data sources.