

Confusion matrix in python: The process of categorizing a given set of data into classes is known as classification.
In Machine Learning, you frame the problem, gather and clean the data, add any essential feature variables, train the model, test its performance, improve it using some cost function, and then it is ready to deploy.
But how do we measure its effectiveness? Is there anything, in particular, to look for?
A simple and broader solution would be to compare the actual and expected values. However, this does not tackle the problem.
Confusion Matrix is one such Error metric for evaluating a model’s performance.
Confusion Matrix in Python:
We occasionally encounter scenarios in which we must apply specific ML algorithms to forecast the outcome of a classification challenge, i.e. business difficulties where the outcome/target/response variable is categorical data. To determine whether an email is SPAM or NOT-SPAM, for example.
So, in the given scenario, we require a specific Error Metric to measure the correctness and exactness of the model for optimum fit.
The Confusion Matrix is an Error Metric used to test the efficiency of Classification Machine Learning Algorithms. It gives us detailed information about the model’s accuracy level, precision rate, and error percentage.
We can distinguish between the actual accurate and predicted outcome of the categorical answer variable by employing a confusion matrix.
So, now that we’ve established the importance of the Confusion Matrix, let’s look at the numerous components that might help us judge and forecast the best-fit algorithm for every model.
- Python Program to Calculate Sum of all Maximum Occurring Elements in Matrix
- Python Program to Calculate Sum of all Minimum Frequency Elements in Matrix
- Program for Transpose a Matrix in Python & C++ Programming
Confusion Matrix Components
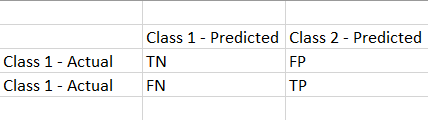
It is a summary of the predictions made by the classification models.
True Negative (TN): Values that are actually negative and predicted to be negative.
False Negative (FN): A value that is truly positive but is predicted to be negative.
False Positive (FP): A value that is truly negative but is predicted to be positive.
True Positive (TP): Values that are actually positive and predicted to be positive.
Here is the additional information that the Confusion Matrix provides on the model:
1)Accuracy:
Accuracy is defined as the percentage of successful predictions based on the input provided.
Formula:
Accuracy = TP + TN / (TP + TN + FP + FN)
2)Precision score: This is the value that identifies the set of values that are correctly predicted as True and are also True in the actual set.
By precision, we imply that the positive values are indeed predicted to be positive.
precision = TP/(TP+FP)
3)Recall score: This is the value that indicates a set of values that are actually True and also predicted to be True,
By recall, we mean that the specific class of samples is accurately predicted.
Recall= TP/(TP+FN)
4)F1 score:
When the data is skewed or unbalanced, the F1 score allows us to evaluate the model’s accuracy and efficiency. It is the harmonic mean of the Precision and Recall scores.
F1 score = 2*(Recall * Precision)/(Recall + Precision)
Implementation of Confusion Matrix
The classification_matrix() method represents the set of values that have been identified properly and incorrectly. Furthermore, the classification_report() function represents the metrics value for each of the input categories, namely ‘F’ and ‘T’.
Approach:
- Import metrics from sklearn module using the import Keyword from sklearn import metrics.
- Give the list of predicted values as static input and store it in a variable.
- Give the list of actual values as static input and store it in another variable.
- Build the confusion matrix using the confusion_matrix() function by passing the given predicted and actual values list and labels as the arguments.
- Store it in another variable.
- Print the confusion matrix.
- Pass the predicted, actual values list and labels as the arguments to the classification_report() function of the metrics and store it in a variable.
- Print the above report.
- The Exit of the Program.
Below is the implementation:
# Import metrics from sklearn module using the import Keyword
from sklearn import metrics
#  Give the list of predicted values as static input and store it in a variable.
predctd_vals = ["F", "T", "F", "T", "F"]
#  Give the list of actual values as static input and store it in another variable.
actul_vals = ["F", "T", "F", "F", "T"]
# Build the confusion matrix using the confusion_matrix() function by passing the
# given predicted and actual values list and labels as the arguments
# Store it in another variable.
rslt_Confusn_matx = metrics.confusion_matrix(predctd_vals, actul_vals, labels=["F", "T"])
# Print the confusion matrix
print(rslt_Confusn_matx)
# Pass the predicted, actual values list and labels as the arguments to the classification_report()
# function of the metrics and store it in a variable
rslt_report = metrics.classification_report(predctd_vals, actul_vals, labels=["F", "T"])
# Print the above report.
print(rslt_report)
Output:
[[2 1]
 [1 1]]
              precision    recall  f1-score   support

           F       0.67      0.67      0.67         3
           T       0.50      0.50      0.50         2

    accuracy                           0.60         5
   macro avg       0.58      0.58      0.58         5
weighted avg       0.60      0.60      0.60         5