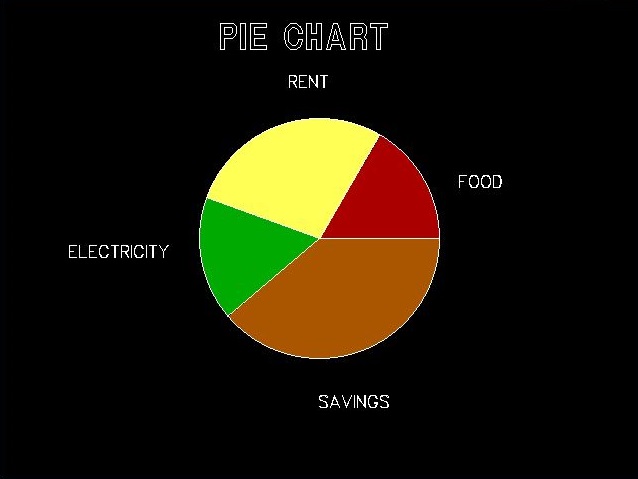
Write a program in C to draw pie chart using graphics.h header file
In this program, we will draw a pie chart on screen having centre at mid of the screen and radius of 120 pixels. We will use outtextxy and pieslice functions of graphics.h header file. Below is the detailed descriptions of graphics functions used in this program.
| Function | Description |
|---|---|
| initgraph | It initializes the graphics system by loading the passed graphics driver then changing the system into graphics mode. |
| getmaxx | It returns the maximum X coordinate in current graphics mode and driver. |
| getmaxy | It returns the maximum Y coordinate in current graphics mode and driver. |
| outtextxy | It displays a string at a particular point (x,y) on screen. |
| pieslice | It draws only a sector of circle having radius r and centre at (x, y), it takes two additional arguments start-angle and end-angle. It also fills the slice with pattern and color set using setfillstyle function. |
| setfillstyle | It sets the current fill pattern and fill color. |
| closegraph | It unloads the graphics drivers and sets the screen back to text mode. |
void pieslice(int xCenter, int yCenter, int startAngle, int endAngle, int radius);
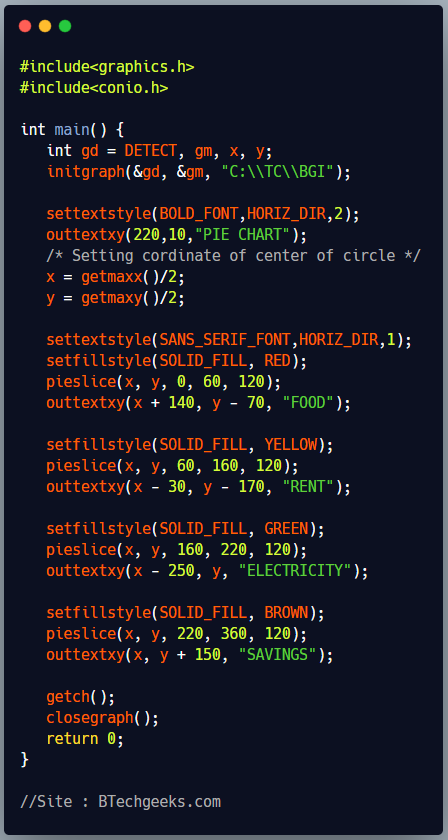
C program to draw pie chart using graphics
In this program we first initialize graphics mode, by passing graphics driver(DETECT), default graphics mode and specifies the directory path where initgraph looks for graphics drivers (*.BGI). Then we will draw multiple pie slices having same center coordinates and radius but varying the start angle and end angle. Before drawing a pie slice we change the fill color using setfillstyle function.
#include<graphics.h>
#include<conio.h>

int main() {
   int gd = DETECT, gm, x, y;
   initgraph(&gd, &gm, "C:\\TC\\BGI");

   settextstyle(BOLD_FONT,HORIZ_DIR,2);
   outtextxy(220,10,"PIE CHART");
   /* Setting cordinate of center of circle */
   x = getmaxx()/2;
   y = getmaxy()/2;

   settextstyle(SANS_SERIF_FONT,HORIZ_DIR,1);
   setfillstyle(SOLID_FILL, RED);
   pieslice(x, y, 0, 60, 120);
   outtextxy(x + 140, y - 70, "FOOD");

   setfillstyle(SOLID_FILL, YELLOW);
   pieslice(x, y, 60, 160, 120);
   outtextxy(x - 30, y - 170, "RENT");

   setfillstyle(SOLID_FILL, GREEN);
   pieslice(x, y, 160, 220, 120);
   outtextxy(x - 250, y, "ELECTRICITY");

   setfillstyle(SOLID_FILL, BROWN);
   pieslice(x, y, 220, 360, 120);
   outtextxy(x, y + 150, "SAVINGS");

   getch();
   closegraph();
   return 0;
}
Program Output