Write a program in C to draw bar chart on screen using graphics.h header file
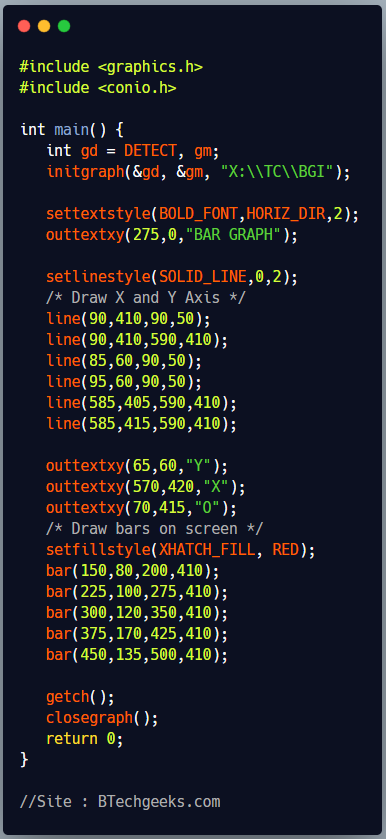
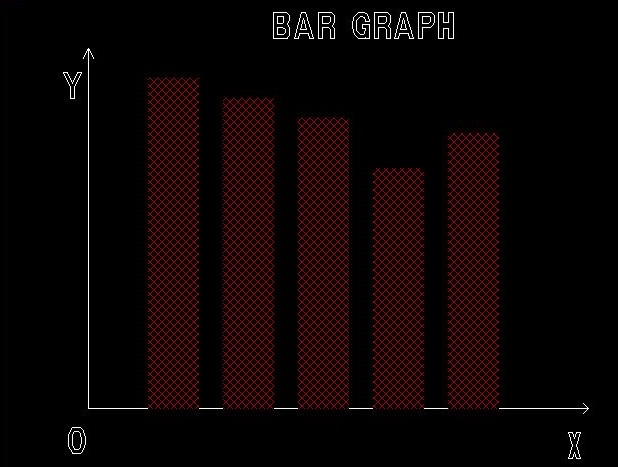
In this program, we will draw a bar graph on screen. Here, we will use line, setfillstyle and bar functions of graphics.h header file to draw horizontal and vertical axis and bars on screen.
void line(int x1, int y1, int x2, int y2);
It draws a line from (x1, y1) to (x2, y2).
void setfillstyle(int pattern, int color);
It sets the current fill pattern and fill color.
void bar(int xTopLeft, int yTopLeft, int xBottomRight, int yBottomRight);
bar function draws a rectangle and fill it with current fill pattern and color.
| Function Argument | Description |
|---|---|
| xTopLeft | X coordinate of top left corner. |
| yTopLeft | Y coordinate of top left corner. |
| xBottomRight | X coordinate of bottom right corner. |
| yBottomRight | Y coordinate of bottom right corner. |
C program to draw bar graph using graphics

#include <graphics.h>
#include <conio.h>

int main() {
   int gd = DETECT, gm;
   initgraph(&gd, &gm, "X:\\TC\\BGI");

   settextstyle(BOLD_FONT,HORIZ_DIR,2);
   outtextxy(275,0,"BAR GRAPH");

   setlinestyle(SOLID_LINE,0,2);
   /* Draw X and Y Axis */
   line(90,410,90,50);
   line(90,410,590,410);
   line(85,60,90,50);
   line(95,60,90,50);
   line(585,405,590,410);
   line(585,415,590,410);

   outtextxy(65,60,"Y");
   outtextxy(570,420,"X");
   outtextxy(70,415,"O");
   /* Draw bars on screen */
   setfillstyle(XHATCH_FILL, RED);
   bar(150,80,200,410);
   bar(225,100,275,410);
   bar(300,120,350,410);
   bar(375,170,425,410);
   bar(450,135,500,410);

   getch();
   closegraph();
   return 0;
}
Program Output

